
Distributional Thinking
When data are collected to address a particular question, an important first step is to think of meaningful ways to organize and examine the data. The most fundamental principle of statistics is that data vary. The pattern of that variation is crucial to capture and to understand. Often, careful presentation of the data will address many of the research questions without requiring more sophisticated analyses. It may, however, point to additional questions that need to be examined in more detail.
Example 1: Researchers investigated whether cancer pamphlets are written at an appropriate level to be read and understood by cancer patients (Short, Moriarty, & Cooley, 1995). Tests of reading ability were given to 63 patients. In addition, readability level was determined for a sample of 30 pamphlets, based on characteristics such as the lengths of words and sentences in the pamphlet. The results, reported in terms of grade levels, are displayed in Table 1.
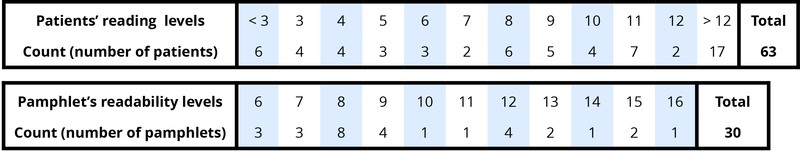
Table 1. Frequency tables of patient reading levels and pamphlet readability levels.
These two variables reveal two fundamental aspects of statistical thinking: Data vary. More specifically, values of a variable (such as reading level of a cancer patient or readability level of a cancer pamphlet) vary.
Analyzing the pattern of variation, called the distribution of the variable, often reveals insights.
Addressing the research question of whether the cancer pamphlets are written at appropriate levels for the cancer patients requires comparing the two distributions. A naïve comparison might focus only on the centers of the distributions. Both medians turn out to be ninth grade, but considering only medians ignores the variability and the overall distributions of these data. A more illuminating approach is to compare the entire distributions, for example with a graph, as in Figure 1.
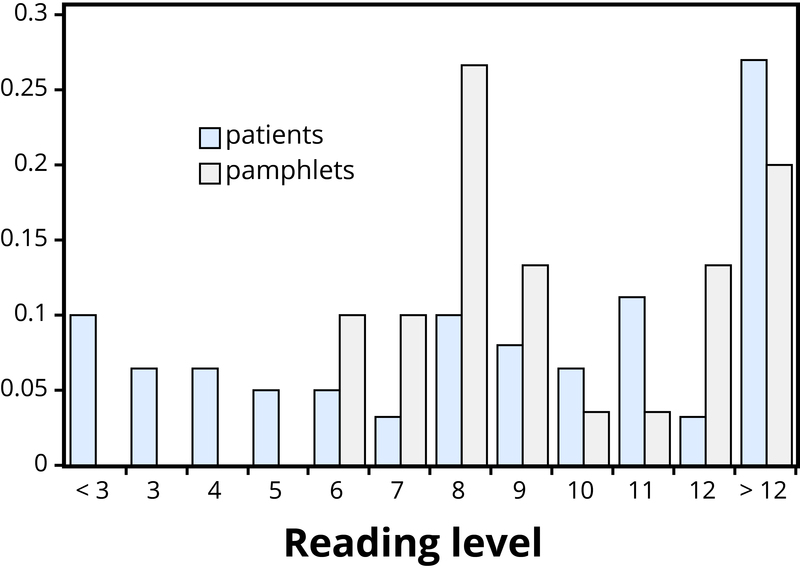
Figure 1: Comparison of patient reading levels and pamphlet readability levels.
Figure 1 makes clear that the two distributions are not well aligned at all. The most glaring discrepancy is that many patients (17/63, or 27%, to be precise) have a reading level below that of the most readable pamphlet. These patients will need help to understand the information provided in the cancer pamphlets. Notice that this conclusion follows from considering the distributions as a whole, not simply measures of center or variability, and that the graph contrasts those distributions more immediately than the frequency tables.
