
Cause and Effect Conclusions
In many research studies, the primary question of interest concerns differences between groups. Then the question becomes how were the groups formed (e.g., selecting people who already drink coffee vs. those who don’t). In some studies, the researchers actively form the groups themselves. But then we have a similar question—could any differences we observe in the groups be an artifact of that group-formation process? Or maybe the difference we observe in the groups is so large that we can discount a “fluke” in the group-formation process as a reasonable explanation for what we find?
Example 4: A psychology study investigated whether people tend to display more creativity when they are thinking about intrinsic or extrinsic motivations (Ramsey & Schafer, 2002, based on a study by Amabile, 1985). The subjects were 47 people with extensive experience with creative writing. Subjects began by answering survey questions about either intrinsic motivations for writing (such as the pleasure of self-expression) or extrinsic motivations (such as public recognition). Then all subjects were instructed to write a haiku, and those poems were evaluated for creativity by a panel of judges. The researchers conjectured beforehand that subjects who were thinking about intrinsic motivations would display more creativity than subjects who were thinking about extrinsic motivations. The creativity scores from the 47 subjects in this study are displayed in Figure 2, where higher scores indicate more creativity.
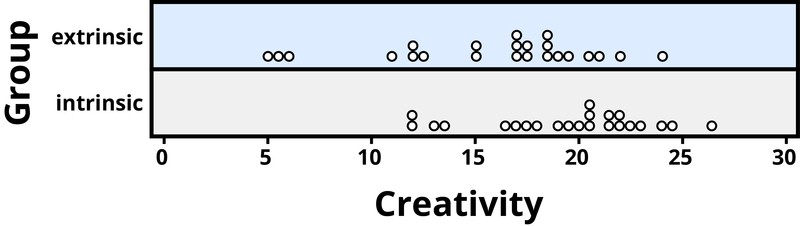
Figure 2. Creativity scores separated by type of motivation.
In this example, the key question is whether the type of motivation affects creativity scores. In particular, do subjects who were asked about intrinsic motivations tend to have higher creativity scores than subjects who were asked about extrinsic motivations?
Figure 2 reveals that both motivation groups saw considerable variability in creativity scores, and these scores have considerable overlap between the groups. In other words, it’s certainly not always the case that those with extrinsic motivations have higher creativity than those with intrinsic motivations, but there may still be a statistical tendency in this direction. (Psychologist Keith Stanovich (2013) refers to people’s difficulties with thinking about such probabilistic tendencies as “the Achilles heel of human cognition.”)
The mean creativity score is 19.88 for the intrinsic group, compared to 15.74 for the extrinsic group, which supports the researchers’ conjecture. Yet comparing only the means of the two groups fails to consider the variability of creativity scores in the groups. We can measure variability with statistics using, for instance, the standard deviation: 5.25 for the extrinsic group and 4.40 for the intrinsic group. The standard deviations tell us that most of the creativity scores are within about 5 points of the mean score in each group. We see that the mean score for the intrinsic group lies within one standard deviation of the mean score for extrinsic group. So, although there is a tendency for the creativity scores to be higher in the intrinsic group, on average, the difference is not extremely large.
We again want to consider possible explanations for this difference. The study only involved individuals with extensive creative writing experience. Although this limits the population to which we can generalize, it does not explain why the mean creativity score was a bit larger for the intrinsic group than for the extrinsic group. Maybe women tend to receive higher creativity scores? Here is where we need to focus on how the individuals were assigned to the motivation groups. If only women were in the intrinsic motivation group and only men in the extrinsic group, then this would present a problem because we wouldn’t know if the intrinsic group did better because of the different type of motivation or because they were women. However, the researchers guarded against such a problem by randomly assigning the individuals to the motivation groups. Like flipping a coin, each individual was just as likely to be assigned to either type of motivation. Why is this helpful? Because this random assignment tends to balance out all the variables related to creativity we can think of, and even those we don’t think of in advance, between the two groups. So we should have a similar male/female split between the two groups; we should have a similar age distribution between the two groups; we should have a similar distribution of educational background between the two groups; and so on. Random assignment should produce groups that are as similar as possible except for the type of motivation, which presumably eliminates all those other variables as possible explanations for the observed tendency for higher scores in the intrinsic group.
But does this always work? No, so by “luck of the draw” the groups may be a little different prior to answering the motivation survey. So then the question is, is it possible that an unlucky random assignment is responsible for the observed difference in creativity scores between the groups? In other words, suppose each individual’s poem was going to get the same creativity score no matter which group they were assigned to, that the type of motivation in no way impacted their score. Then how often would the random-assignment process alone lead to a difference in mean creativity scores as large (or larger) than 19.88 – 15.74 = 4.14 points?
We again want to apply to a probability model to approximate a p-value, but this time the model will be a bit different. Think of writing everyone’s creativity scores on an index card, shuffling up the index cards, and then dealing out 23 to the extrinsic motivation group and 24 to the intrinsic motivation group, and finding the difference in the group means. We (better yet, the computer) can repeat this process over and over to see how often, when the scores don’t change, random assignment leads to a difference in means at least as large as 4.41. Figure 3 shows the results from 1,000 such hypothetical random assignments for these scores.
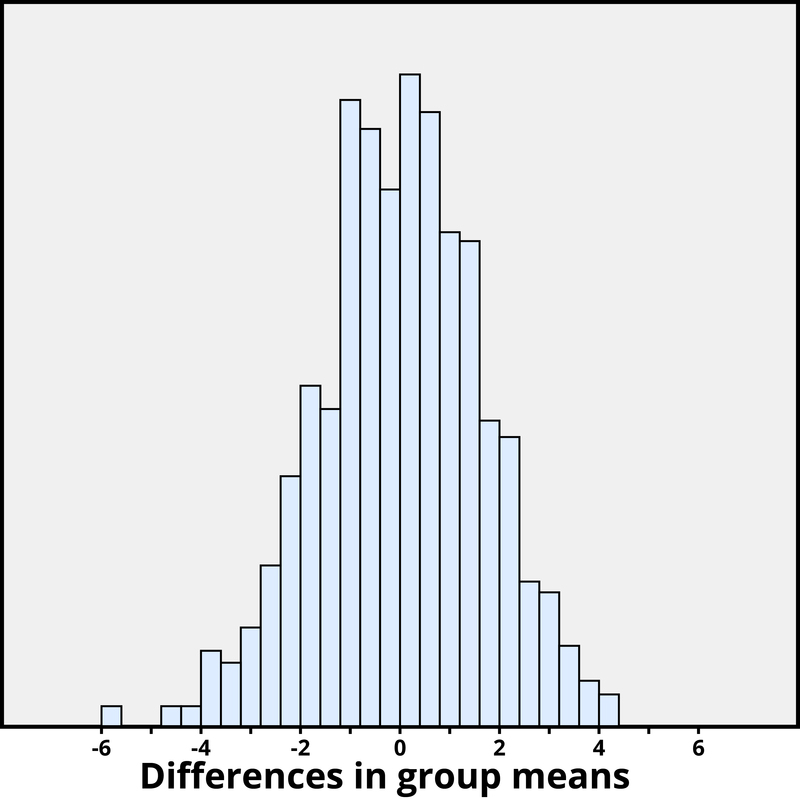
Figure 3. Differences in group means under random assignment alone.
Only 2 of the 1,000 simulated random assignments produced a difference in group means of 4.41 or larger. In other words, the approximate p-value is 2/1000 = 0.002. This small p-value indicates that it would be very surprising for the random assignment process alone to produce such a large difference in group means. Therefore, as with Example 2, we have strong evidence that focusing on intrinsic motivations tends to increase creativity scores, as compared to thinking about extrinsic motivations.
Notice that the previous statement implies a cause-and-effect relationship between motivation and creativity score; is such a strong conclusion justified? Yes, because of the random assignment used in the study. That should have balanced out any other variables between the two groups, so now that the small p-value convinces us that the higher mean in the intrinsic group wasn’t just a coincidence, the only reasonable explanation left is the difference in the type of motivation. Can we generalize this conclusion to everyone?
Not necessarily—we could cautiously generalize this conclusion to individuals with extensive experience in creative writing similar the individuals in this study, but we would still want to know more about how these individuals were selected to participate.
