
SAS Programming
11 Working with Missing Data
In this section, we will work through the concepts of dealing with missing data using specific examples that are demonstrated with SAS coding, and which are based on the SAS Studio Education Analytic Suite.
Missing Values
Missing data are observations that we intended to record but did not. Values can be missing for different reasons and most of the time we don’t know the exact reason why people didn’t answer certain questions. However, we can look at how much data is missing as well as the patterns of missing values and determine whether missingness is related to the variable itself, other variables in the dataset, or has no apparent pattern. In the following sections, we will go through three categories of missing data that are commonly used in research to explain why data is missing.
How much data is missing?
The overall percentage of data that is missing is important. Generally, if less than 5% of values are missing then it is acceptable to ignore them (REF). However, the overall percentage missing alone is not enough; you also need to pay attention to which data is missing. Often you may need to consider deleting cases (participants) or individual variables that are missing a ton of values. This step alone can drastically improve the integrity of your data and reduce the overall percentage of missing values in your dataset.
Types of Missing Data
There are several types of missing data, as we will discuss here. Some types are easy to consider and account for, while others are confusing and may be less obvious to the novice researcher.
Data Missing at Random
In this situation, data is not actually missing at random which makes the name of the category very confusing! MAR data happen when missing values are related to another variable in the data set. That is, the missing value (y) depends on x, but not y (itself). Here are some examples:
Example 1:
In a survey of health care professionals, nurses do not report their age. In this case, being a nurse (x) predicts the missing data for age (y).
Example 2:
In a family survey, single parents do not report their income. In this case, being a single parent (x) predicts the missing data for income (y)
Example 3:
Employees who fear their manager do not report their job satisfaction. In this case, employees might be afraid to report their job satisfaction for fear of reprisal.
Note that in real life you might find MAR patterns in your data but the rationale behind them is still speculative. Unless you go back and check with the participants it is impossible to prove.
Missing Completely at Random (MCAR)
Missing data that doesn’t have a pattern of missingness is referred to as data missing completely at random (MCAR). This is the ideal situation when you have missing data because missing values are random so any influence they have on your analysis is also random. Here are some examples of MCAR situations:
Example 1:
You conduct a study on heart transplant patients and discover that 10 patients did not answer 2-3 questions on your survey. The questions that are missing are different for each person and there is no pattern.
Example 2:
You conduct an RCT comparing the effects of fish oil supplementation versus placebo on anxiety levels in nursing students. 1 patient in the control group forgot to take their supplement on Sept 10th because they were busy. 2 patients in the experimental group missed their dose on October 3rd and Nov 19th, respectively. One woke up late. The other one burnt their breakfast and got distracted.
There is NO pattern causing the missing data.
Not Missing at Random (NMAR)
The last category is data not missing at random. In this situation, missingness is because of the variable itself. In other words, there is a reason why people don’t want to answer that particular question. Usually this happens with sensitive questions.
Example 1:
People who are overweight do not report their weight. In this case, being overweight (x) predicts the missing data for weight (x).
Example 2:
Single parents do not report their marital status. In this case, being a single parent (x) predicts the missing data for marital status (x).
Analyzing Missing Values
The default in SAS is to delete missing values from your analysis. The effect this has on your results depends on how much of your data is missing. SAS offers a number of robust options for dealing with missing data but the focus of this section is on being able to see how much of your data is missing and examine patterns.
One of the easiest ways to examine missing data patterns is to use the PROC MI command which is the multiple imputation (MI) procedure in SAS.
The following code uses the NIMPUTE=0 option to create the “Missing Data Patterns” table for the specified variables.
ODS SELECT MISSPATTERN;
PROC MI DATA = NAMEOFDATASET NIMPUTE=0;
VAR VAR_1 VAR_2 VAR_3;
RUN;
Let’s do an example together:
In this example you are interested in knowing more about stress levels of caregivers of older adults with dementia. You send out a pilot survey and get an initial sample of 16 people to answer it. The questionnaire includes demographic variables and a five-item questionnaire to measure stress rated on a 5-point Likert scale from 1 = strongly disagree to 5 = strongly agree. Higher scores indicate higher levels of stress.
The first step of course is to set up your data file in SAS:
OPTIONS PAGESIZE=60 LINESIZE=80 CENTER DATE;
DATA CAREGIVER;
LABEL
ID = ‘PARTICIPANT ID’
STRESS1 = ‘CAREGIVER STRESS QUESTIONNAIRE ITEM 1’
STRESS2 =‘CAREGIVER STRESS QUESTIONNAIRE ITEM 2’
STRESS3 = ‘CAREGIVER STRESS QUESTIONNAIRE ITEM3’
STRESS4 = ‘CAREGIVER STRESS QUESTIONNAIRE ITEM4’
STRESS5 = ‘CAREGIVER STRESS QUESTIONNAIRE ITEM5’
SEX = ‘SEX’;
INPUT ID 1-2 SEX 4 STRESS1 6 STRESS2 8 STRESS3 10 STRESS4 12 STRESS5 14;
DATALINES;
01 0 4 3 4 5 4
02 1 3 2 3 4 4
03 1   3 3   3
04 0 1 2 1 2 3
05 1 4 4   5 3
06 1 2 3 3 4 4
07 0 3 3 5   5
08 1 3 5 4 5 3
09 1 4 4 5 4 4
10 1   2 4 4 4
11 0 4 3 4 5 5
12 1 2 1 2 3 4
13 0 1 2 4 4 2
14 1 3 4 4 5 4
15 1 3 4 5 4 3
16 1   4 3 2 1
;
RUN;
Next we use the MI code template but we replace NAMEOFDATASET with the actual name of our dataset (CAREGIVER) and replace the VARIABLE NAMES with the actual names of the variables in our dataset:
ODS SELECT MISSPATTERN;
PROC MI DATA = CAREGIVER NIMPUTE=0;
VAR ID SEX STRESS1 STRESS2 STRESS3 STRESS4 STRESS5;
RUN;
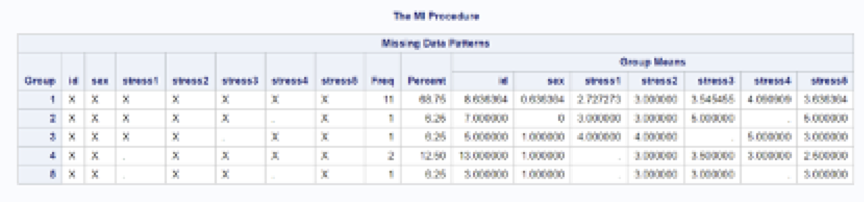
As you can see in the figure below, SAS uses this code to produce a table showing the number of cases with each pattern of missing data. First we look at the lefthand side of the table to examine the patterns of missingness in our dataset. In this example, you can see that Group 1 has no missing data because there is an “X” in each of the variables in the dataset. This means that there is data for each variable for participants in this group. The frequency of participants in this group is in the column labelled “freq” and you can see that there are 11 people with no missing values. By looking at the next column over which is labelled “percent”, we can see that this represents 68.75% of the sample.
The next pattern of missing data is Group 2. Looking across the columns, we can see that there is no “X” for stress4. This means that participants in Group 2 answered all the questions except that one. There is only 1 person in this group and they represent 6.25% of the data. We can continue doing the same interpretation for Groups 4-6 in the table.
This table also provides the means for each of the variables. Again, don’t forget that “means” for some variables are not meaningful. For example, the mean values provided for Participant ID and sex should be ignored here. What is valuable though is that for continuous variables you can compare their means for participants with different patterns of missing data. For example, for the variable Stress2, you can see that the mean is the same for Groups 1, 2, 4, and 5 but it is higher for Group 3. Although this is a small sample for illustrative purposes, you can hopefully see how the information in this table can help you understand the patterns of missing values in your data better.
Output table showing patterns of missing values
Finally, consider that in research we can always expect to have missing data for a variety of reasons. The SAS program provides a powerful platform for calculating data while recognizing strategies to handle missing data.
