
Basic Principles
6 Types of Research Designs
Research Designs
While we discussed the hierarchy of evidence previously, it is important to note that different research designs are appropriate for different situations and research questions. In other words, each design type is fit for a specific purpose. For example, a case report might be the best choice for examining a new condition that has not been seen before, while a randomized controlled trial would not be appropriate. In this chapter we will review a number of research designs that fall into two broad categories: 1) Observational Research Designs, and 2) Experimental Research Designs.
Common research designs include:
- Case report or case series
- Ecologic
- Cross-sectional
- Case-control
- Longitudinal
- Cohort
- Randomized controlled trials
Observational Research Designs
Observational research designs are used by researchers to draw inferences about a sample or population without intervention by the researcher or research team- exposure to the independent variable, such as a treatment for a disease, is not influenced by the study. Observational studies provide data that allow the researcher to conduct descriptive and analytic research. Descriptive observational studies typically focus on the person, place or time of an event of interest and are useful to help identify patterns and generate hypotheses, but cannot test them. For example, you may be interested in describing the incidence of colon cancer in men and women living in Prince Edward Island, Canada between 2000 and 2020. In an analytic observational study, the researcher goes a step further to include comparisons groups and test hypotheses. For example, in your previous study you may have noted the pattern of colon cancer diagnoses appears different between men and women. In your analytic study, you may then compare the risk of colon cancer between the two groups. Observational studies allow you can find out a lot about the current situation and examine relationships between variables but can be limited in their understanding of causality, or attributing cause and effect between two variables.
Case Reports and Case Series
Case reports in health research are generally defined as published reports of an individual patient or event or small group of patients or events that demonstrates unique characteristics of interest. Typically, the reporter uses a comprehensive and detailed assessment of the individual to describe features that are atypical of normal observations, such as combinations of presenting signs and symptoms, disease sequelae or trajectory, or unexpected outcomes. For example, a case report in the February 27 2014 issue of the New England Journal of Medicine described the a four month old infant who required surgery for a brain tumour, which contained multiple fully formed teeth.
Case series can be described simply as a collection of individuals or events that are used to describe aspects of a disease, treatment or diagnostic procedure, also known as a series of case reports. Typically a practitioner, such as a clinician, researcher, healthcare provider, and social worker, among others, using a standardized format, draws the cases from an accumulation of documented case reports. A major condition in forming a case series is that although collected as independent units, to be eligible as a case within the series, each individual selected for the case series demonstrates common characteristics of interest. For example, a seminal case series published in the Lancet in September 1981 described eight men with Kaposi’s sarcoma and hypothesized a link between sexually transmitted infections and the development of these lesions. It has since been established that Kaposi’s sarcoma, a cancer, is caused by the human herpesvirus 8 (HHV-8) and is thought to spread through blood and saliva during sex or from maternal-to-infant transmission during birth.
Case reports and case series can identify new trends or diseases, detect drug side effects or new uses, share experiences with rare events, or describe uncommon disease phenomenon. These studies are important as they can be where new issues or ideas emerge and generate hypotheses for further exploration. However, because they are single events or a small series of events, they may not be generalizable, may incorrectly attribute cause and effect and as a result be misleading, and are not based on rigorous research methods. Rather, the case report, as a unit, provides a reference to a specific observation that alerts a community of practice and which can then be documented for future study and comparison. The information from the case series can be used to build a knowledge base and develop hypotheses tested in more rigorous study designs.
Cross-sectional Research Studies
Before we begin discussing cross-sectional studies, let’s define the term prevalence. Prevalence is described as the frequency of a condition of interest measured at an instantaneous point in time. The prevalence score, or prevalence estimate, is sometimes referred to as the point-prevalence rate because it provides an estimate of the number of cases within a sample taken at a point in time. The prevalence estimate takes on a rate value when compared to the total number of individuals at risk within the sample.
Given this definition of prevalence, we can say that a cross-sectional research design enables the study of prevalence. The prevalence rate is typically used in cross-sectional studies where the measurements are made only once across a selected sample. Prevalence rates can be considered generalizable to a larger population if the sample upon which the estimate is made is truly representative of the population from which it was drawn.
Figure 6.1 below depicts the application of a cross sectional research design. Notice a sample is first identified from an existing population and then from the sample (k) groups are drawn. In this image 2 groups were drawn at random from the sample, each group having the same number of individuals, with similar characteristics.
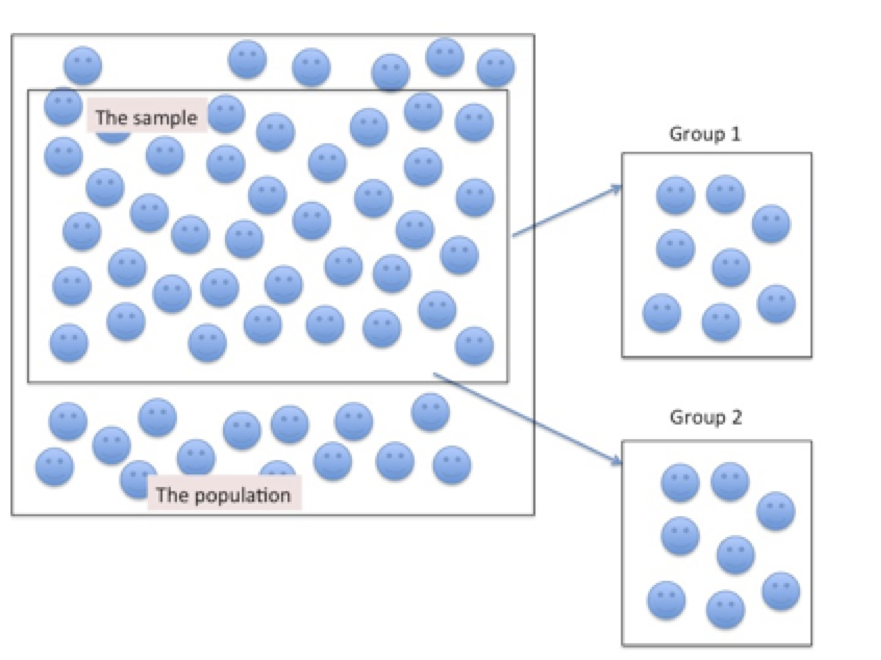
Figure 6.1. Sampling Participants for a Cross-sectional Research Design
Characteristics of the cross sectional research design
A positive characteristic of the cross sectional study design is that because data collection occurs only during a single bout (one time sampling), there are fewer costs than in a longitudinal research study. However, a negative consequence of one time sampling is that some individuals that may influence the outcome for the study can be missed during the sampling phase. Likewise, because there is no follow-up of the sample, and often no historical information preceding the sample, very little can be inferred about causal relationships from the sample. The cross sectional study design provides a snapshot of sample characteristics at a specific point in time – when the data were collected.
Case-Control Research Studies
Case-control research studies are typically retrospective studies as they are used to compare groups of individuals that were identified as having a condition of interest – the cases – against a similarly matched group of individuals that do not have the condition of interest – the controls. Cases are identified from the sampling frame, by the investigator, for individuals that demonstrate the specific characteristics of the condition of interest. Controls – individuals that do not demonstrate the characteristics of the condition of interest– are matched to the case subjects on the basis of relevant measures that help to identify (or exclude) causes of the condition of interest. In conducting the case-control research study, the investigator identifies a set of suspected causes and then searches backward in time to compare differences in the suspected causal variables between cases and controls to help explain why cases differ from matched controls.
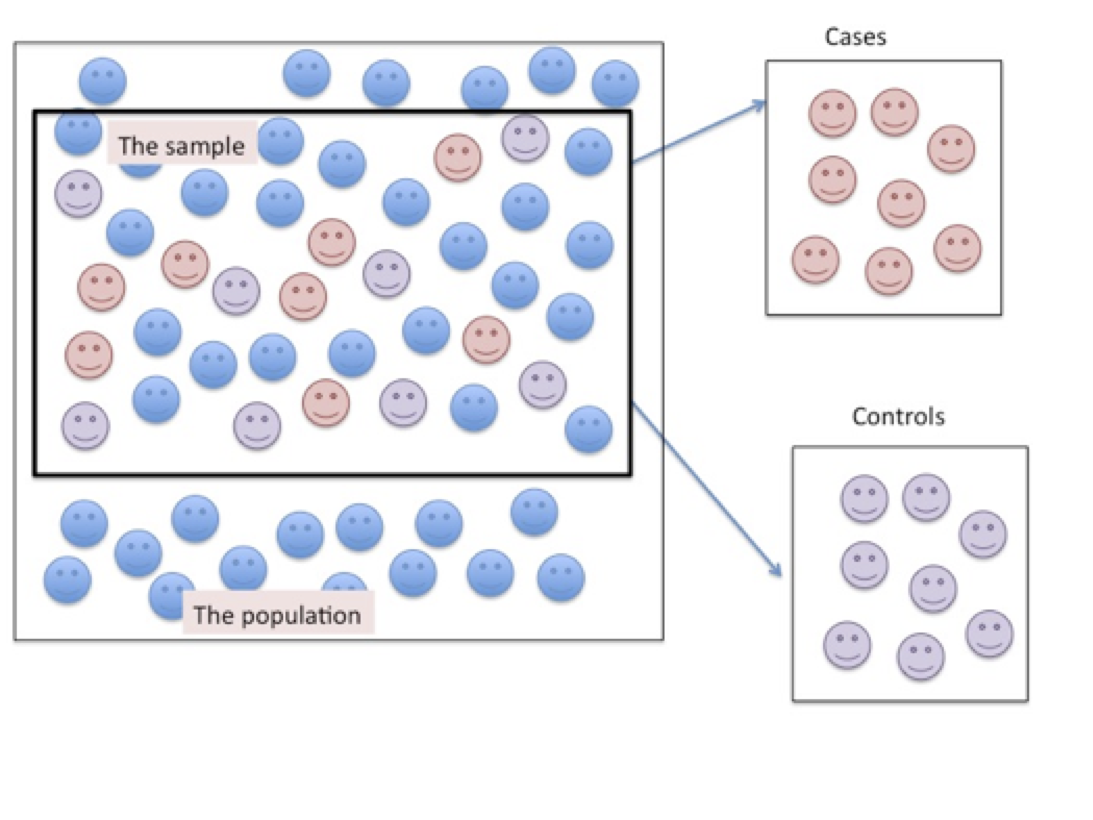
Figure 6.2. Sampling Participants for a Case-control Research Design
As shown in Figure 6.2 above, the cases are similar to the controls but differ only on the condition of interest. In both the case and the control groups the researcher is not trying to make an inference to the population in general, from which the sample was drawn, but is demonstrating the likelihood that an event can be attributed to a specific causal mechanism.
Characteristics of the case-control research design:
In the case-control research design, the researcher is attempting to identify causal mechanisms for a condition of interest by comparing an outcome in known cases against the lack of an outcome in similarly matched controls. Since the sample is not representative of the larger population, and because the cases are selected by the investigator, the influence of selection bias is high, and the generalizability to a population from which the cases were identified is low. Likewise, because the total number of at-risk individuals in the population is not considered in this design, the incidence of the outcome cannot be estimated and relative risk can only be estimated in specific scenarios. However, the case-control research design enables the researcher to establish a proportional representation of cases drawn from a sample against the number of individuals not demonstrating the condition of interest and thereby present estimates of likely causes. Using the odds ratio (OR) estimator, the researcher is able to compute the odds that a case is (OR) times more likely to be affected by a suspected causal mechanism (exposed) than a control (unexposed).
In the case-control design, the stimulus (or exposure condition) suspected to cause the condition of interest is not manipulated by the researcher. However, because of the comparison between observed cases and matched controls, researchers can evaluate risk factors by comparing the proportion of individuals exposed to a suspected causal agent that demonstrate a particular outcome versus the proportion of individuals not exposed to a suspected causal agent that do not demonstrate a particular outcome, while controlling for the proportion of individuals that demonstrate the outcome of interest but were not exposed versus the proportion of individuals that were exposed and did not demonstrate the outcome of interest.
Case-control studies are used extensively in epidemiological investigations to assess risk and help to determine the cause of outcomes. For example, in outbreak investigations, the case-control design is used to determine the risk associated with exposure to the suspected causal agent; in lung cancer studies the case-control design is used to establish the link between and cancer outcomes; in maternal health, the case-control design is used to show the benefits of breastfeeding duration and on the development of asthma and wheeze.
One of the difficulties in conducting the case-control design is that the researcher needs to establish the case definition precisely, and maintain consistency in selecting participants to the appropriate cells of the 2×2 matrix when analyzing the data with a simple odds ratio estimate, as shown in Table 6.1.
Table 6.1. Structure of the 2 x 2 table to calculate the Odds Ratio
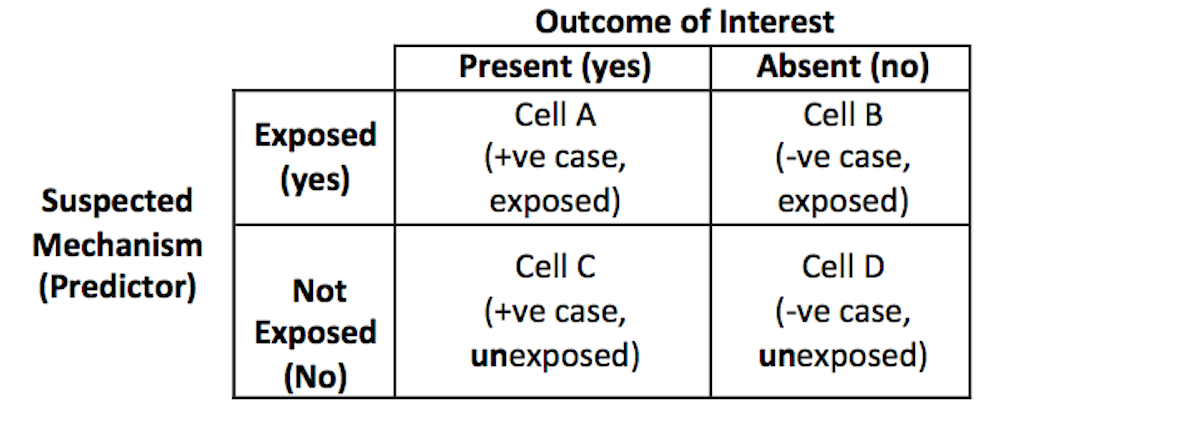
In computing the odds ratio for the case-control study, the researcher is comparing the ratio of exposure within the sample of cases (a/c) to the ratio of the exposure within the control group (b/d). The odds ratio is then the ratio of the two ratios: (a/c) ÷ (b/d).
Longitudinal Studies
Longitudinal studies are a form of observational study. However, unlike the cross-sectional study where variables in a sample of participants are measured at a single point in time, and the case-control study design where the outcome is measured first and the risk factors after the outcome has occurred, the longitudinal study measures variables in a sample of participants over a period of time. Further, because the longitudinal study design is observational, the study design does not allow the researchers to intervene or impose any stimuli on the participants. Yet, because the study design is longitudinal, the researcher can collect data throughout the time period according to an apriori measurement schedule and evaluate outcomes at the level of the individual. Longitudinal study designs are thus often referred to as time-lagged, pre-post, or repeated measures designs. Note that for a study to be truly longitudinal, at least three time-points of data must be collected.
An important estimate in longitudinal studies is often the incidence rate (also referred to as the incidence density rate). The incidence rate is defined as the number of new cases observed within a given time period divided by the population at risk during the specified time period. Computing the incidence rate enables the researcher to determine the effects of a specific treatment regimen, monitor adherence to a prescription, assess the effects of ageing, or determine the compliance to policies.
Cohort Studies
One of the most common types of longitudinal study designs is the cohort study. The cohort study is an observational study in which the researcher simply observes an outcome without intervening. Cohort studies follow a group of individuals with similar characteristics either forward in time (prospectively) or backward in time (retrospectively). Cohort study designs are used to study incidence rates. In the cohort study, the group demonstrating the characteristic(s) of interest are followed for a period of time while being compared to a similar group that does not demonstrate the characteristic(s) of interest. Specific measures in the designated group are compared to those reported for the comparison cohort. Throughout the monitoring stage, measures are taken typically at the onset of monitoring, at pre-designated points throughout, and then again at the completion of the study.
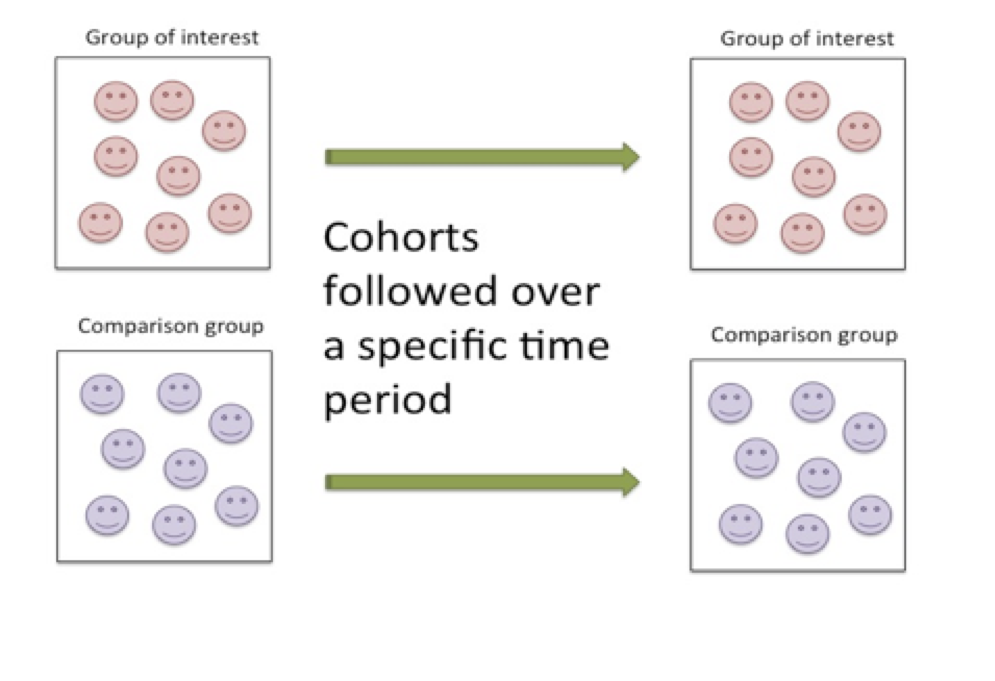
Figure 6.3 Monitoring Characteristics of the Cohort Research Design
Characteristics of the cohort research design:
Strengths of the cohort research design include the capability to monitor individuals with rare exposures and study the multiple effects of a single exposure. Cohort studies are also useful when evaluating a temporal relationship (time-based) between exposure and outcomes because the individuals are followed over a specific period of time and are compared to non-exposed individuals drawn from the same population during the same time period. Likewise, given that cohorts are homogenous groups of individuals demonstrating like characteristics and only differing on the measure of interest, concurrent cohort research designs can be used to minimize the bias due to sampling as in selection bias and over-estimation in the treatment group.
Since cohort studies require that the researchers follow the designated groups for prolonged time periods, cohort studies tend to be expensive. Often as a result of the prolonged-time period required to ensure complete observations, the cohort study suffers from loss to follow-up, which can essentially invalidate the study. In order to ensure the precise estimation of incidence, cohort studies require attention to detail in the follow-up stages.
In cohort studies, the estimate of relative risk is used to show the ratio of the probability of those exposed versus the probability of those not exposed. In table 6.2, the structure of a 2×2 computational arrangement to calculate relative risk is shown.
The formula for relative risk is given as the ratio of – the proportion of individuals within an exposed group showing a condition versus the proportion of individuals within a non-exposed group showing a condition à (cell a / (cell a + cell b)) ÷ (cell c / (cell c + cell d)).
| Exposed | Cell A
+ condition + exposed |
Cell B
– condition + exposed |
The numerator (a/(a+b)) |
| Not exposed | Cell C
+ condition – exposed |
Cell D- condition – exposed | Denominator (c/(c+d)) |
Relative rRisk = (a/(a+b)) + (c/(c+d))
Table 6.2 Relative Risk derived from a 2 x 2 Computational Arrangement used in the Cohort Research Design
According to Grimes and Schulz (2008), an estimates odds ratio can be used to compute the relative risk score as shown here:
RR = (Odds Ratio) ÷ [(1- P0) + (P0 x OR)] Eq (6.1)
However, in cohort studies of rare diseases the odds ratio factor is negligible to the estimate of relative risk because P0 approaches 0 when the disease is rare. As such the relative risk estimate in a cohort study of rare disease cases is equal to the odds ratio. Computations of relative risk and odds ratios are discussed in more detail later in this text.
Experimental Research Designs
In its simplest form, an experiment is an evaluative procedure in which the researcher controls the conditions that are applied to a selected group of participants and they observe the occurrence of an outcome. For example, consider an experiment to determine the effect of using a drug versus a placebo on changes in resting systolic blood pressure.
In step 1, the researcher randomly selects a group of individuals from the population. The individuals in the group are then randomly allocated to either of two groups – the drug group versus the placebo group. In step 2, the individuals in both groups are measured for their resting systolic blood pressure. In step 3, individuals from the drug group receive a pill that is purported to alter blood pressure. In the other group-the placebo group, the individuals receive a similarly shaped pill that is a placebo. In step 4, the individuals in both groups wait for one hour and then are again measured for their resting systolic blood pressure. The difference between the systolic blood pressure measurements is compared in two ways.
First, the average change in blood pressure in the drug group is compared to the average change in blood pressure in the placebo group. Next, the average pre blood pressure is compared to the average post blood pressure in the drug group separate from the placebo group. The series of events in this simple experimental design are shown in the following illustrations. In Figure 6.3, participants are randomly selected from the population and randomly allocated to either the drug group or the placebo group.
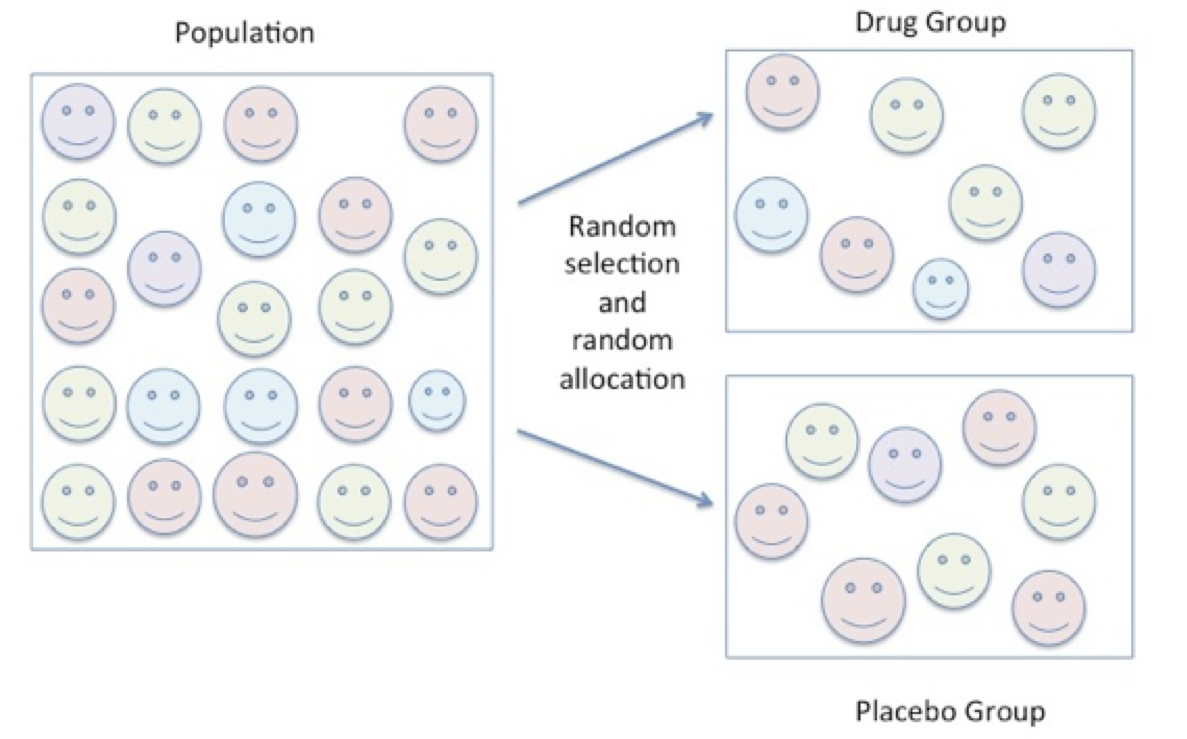
Figure 6.4 Random Selection and Random Allocation
Next, resting systolic blood pressure is measured for each participant in each group after the individual has been allocated to the groups and then again after one hour following the ingestion of either the drug or the placebo.
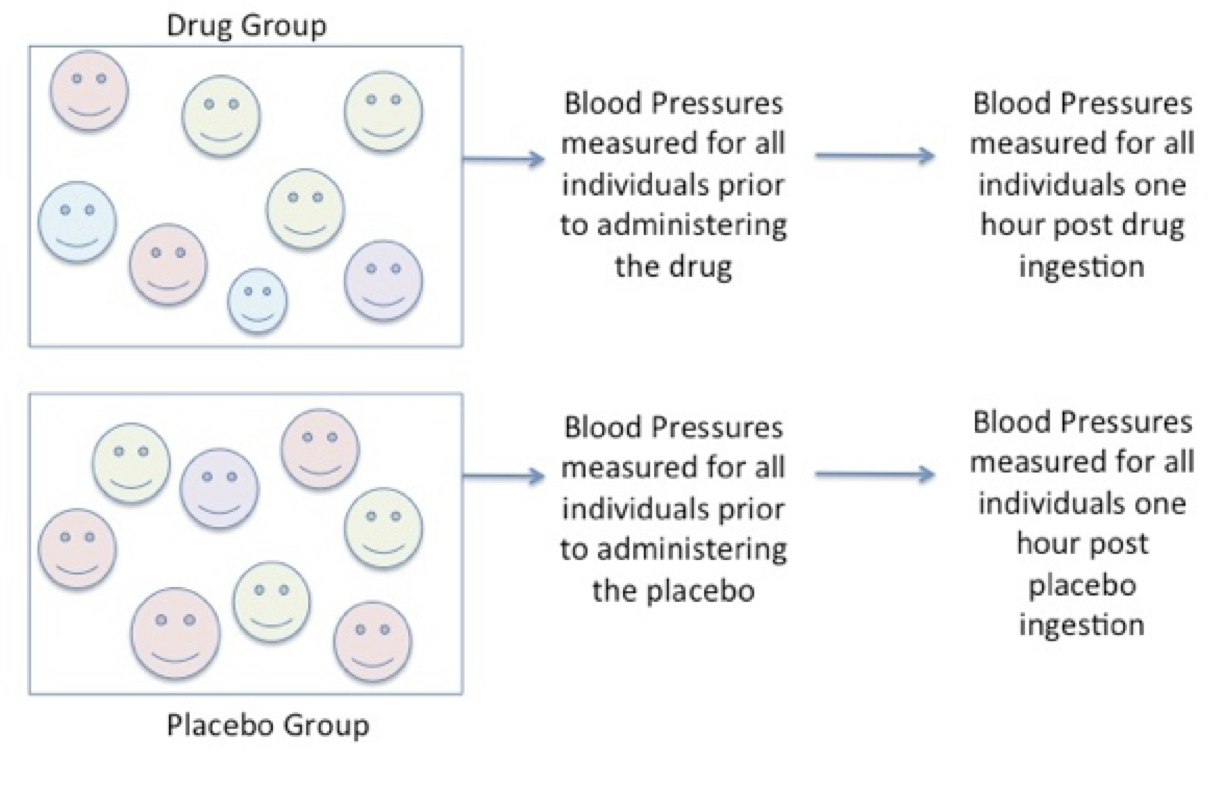
Figure 6.5. Consistent Measures in Each Group
Statistical comparisons can be made using an estimate from the group, like the mean to compare the effect of the drug versus the placebo. Pre to post means are compared within each group as shown in comparison 1(a) and in 1(b). A second comparison is made between the pre to post difference in the drug group versus the pre to post difference in the placebo group.
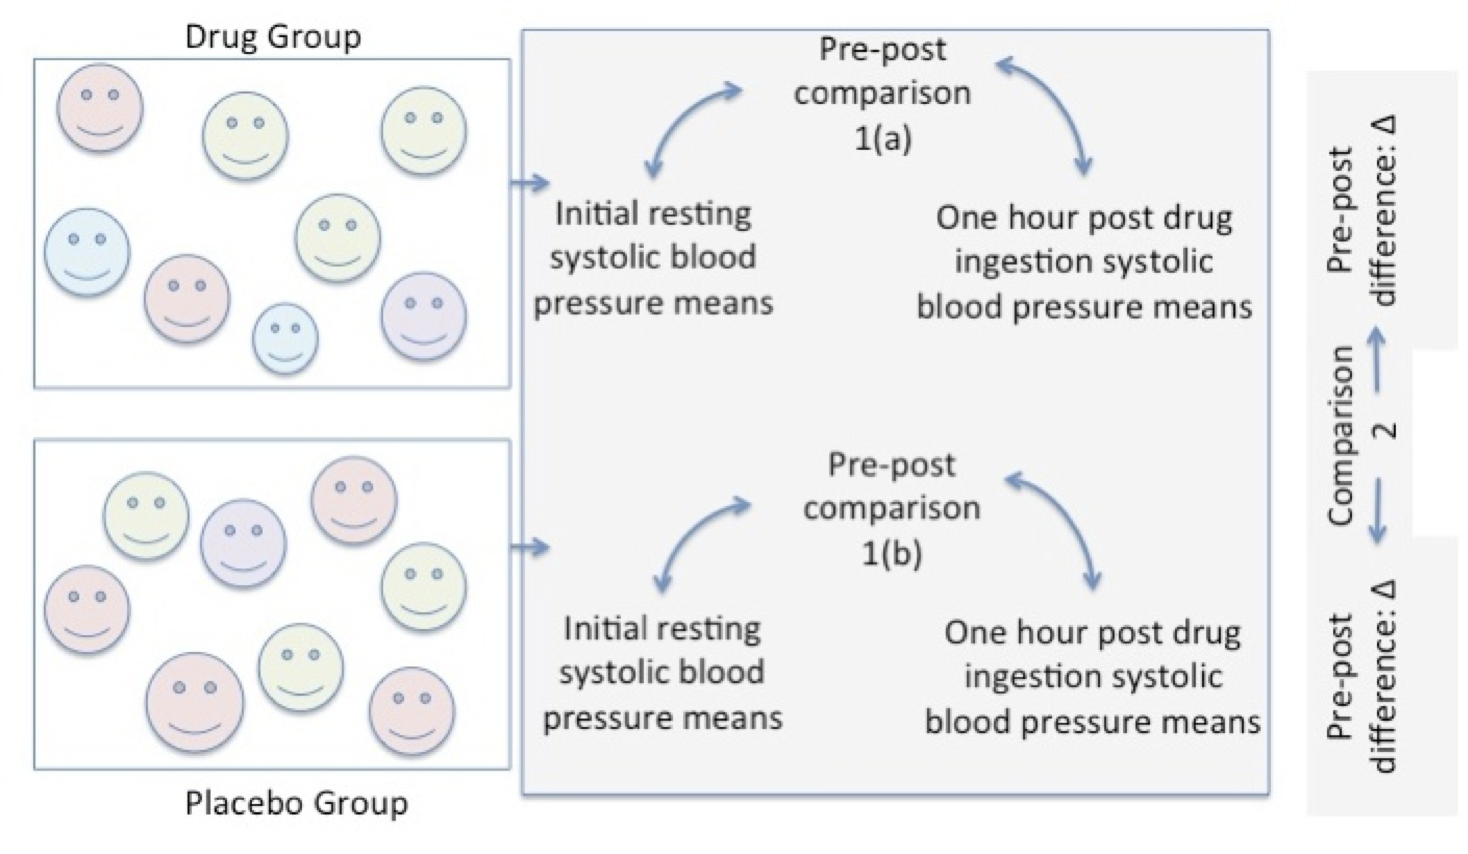
Figure 6.6 Pre-Post Comparison in Each Group
