
SAS Programming
8 Components of a SAS Session
Every SAS session produces three files:
- The SAS code file (.sas): This is the set of instructions that are submitted to the central processing unit of the computer through the SAS engine to generate output (results). You can use the program file editor in SAS Studio to create the .sas file. Your SAS instructions are included in the filename.SAS program file as it is the file that you submit to be processed by the SAS engine which in turn creates output files and log files.
After you have successfully started the SAS Studio you will see the image below on your screen. Be sure to select the SAS Programmer work mode as shown in the image. This is the SAS Studio operation in which you can function as a SAS programmer. In this text, we will use the SAS Studio software to practice statistical analyses for a variety of questions that you may generate in health-related research.
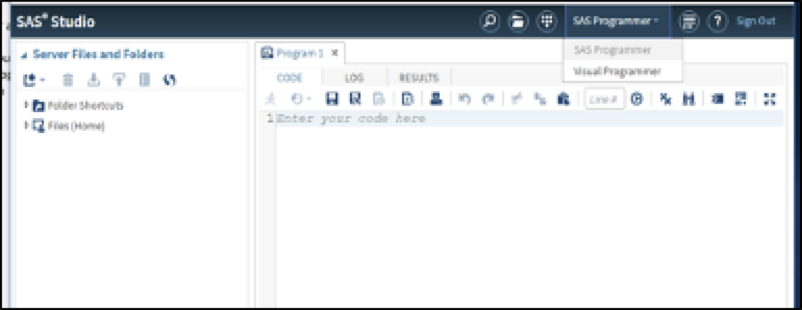
Figure 8.1 The landing page for SAS Studio in SAS University Edition
Note that there are two work modes in the SAS Studio: 1) SAS Programmer and 2) Visual Programmer. In the examples presented in this text, we selected the SAS Programmer mode (Figure 8.1).
SAS programs are written to the code page provided within the SAS Studio. The editor function enables you to create the program, submit the program and evaluate the output.
- The output file. In SAS Studio, the output file is accessed from the RESULTS tab of the program editor page, after your SAS code file has been submitted for processing. The RESULTS can be downloaded in the form of either an HTML file – which you can access through a browser, as a PDF file, or as a word document file – in RTF format. The output file is what you are trying to produce with your SAS code as it is the file that is generated from the statistical processing of your data. If you should end the session without retrieving the results in one of these formats then it will not be stored, and you will need to resubmit the program in order to view the output.
After you have successfully submitted the SAS program you can click on the RESULTS tab to view the output that you have generated with your SAS code.
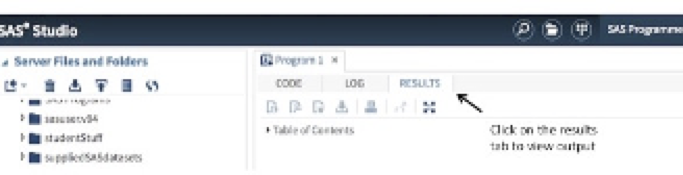
Figure 8.2 Where to find the RESULTS screen for the SAS Studio in SAS University Edition
* SAS code that runs without errors will generate output in the window shown in Figure 8.1 above.
- The log file: The LOG file keeps track of what you do in SAS. It is accessed from the LOG tab of the program editor after your SAS code has been processed. The log file is extremely valuable as it details the steps that the SAS engine used to generate the results from the series of commands that you entered in your SAS code file. The log file also includes any error messages and warnings that result from the submitted SAS code file. The LOG file presents the specific processing activities of the SAS engine which thereby show you the incorrect syntax or inappropriate command choices and sequences that you may have included in your SAS code file. The SAS LOG file is extremely valuable to you as a programmer as it can show you exactly what you did in the code file that the SAS processing engine didn’t like.
Similar to the generation of the RESULTS file, after you have successfully submitted the SAS program you can click on the LOG tab to view the processing sequence of the commands that you submitted in your SAS code. All SAS code submissions will generate a LOG file as shown in the image below.
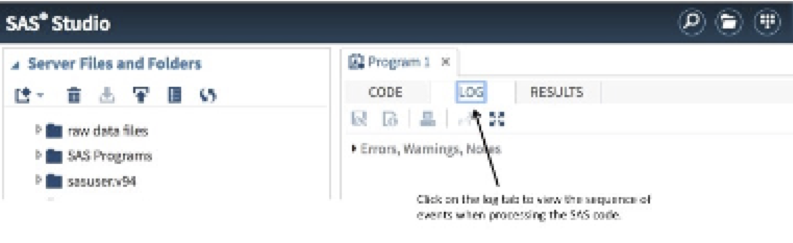
Figure 8.3. Log screen for the SAS Studio in SAS University Edition
The log file includes any error messages and warnings that result from the submitted SAS code file, allowing you to identify and resolve problems.
Entering Data and Writing a SAS Program
In the following section, we describe the process of creating a SAS program to analyze data that we have collected. Later we will learn how to import data from several sources as external data sets but for now, we will enter the data by hand.
Syntax and Variable Type are Important
• Syntax refers to the structure of the language. All computer languages have a specific syntax with distinct rules related to the composition, arrangement and phrasing of commands.
• In SAS programming there are distinct composition and structural arrangement requirements in order for the SAS Processing Engine to understand the code sequence and perform the anticipated analysis.
• In SAS the Statistical Procedures are referred to as Procs – pronounced “PROCK”
• In SAS all command paragraphs end with a semi-colon
• In SAS we must define all alphanumeric variables by including a $ after the variable name, but we can include decimal length indicators if we choose when using continuous measures.
An annotated practice example
Let’s write our first SAS program using data for a simple reaction time experiment.
In our experiment, we will use a sample of 5 males and 5 females (total n = 10). We record each participant’s age and their score on a simple reaction time test.
To measure reaction time, we drop a meter stick from 1.5m off the floor and have each participant to catch it between their fingers.
This simple test has been modified for use in the assessment of reaction time testing for concussed patients and is commonly referred to as the Sideline-Drop stick test[1]. The score is a measurement in centimetres, of the distance that the metre stick travels between the participant’s fingers from the start of the test to when the participant secured the stick. We can use the distance and the speed of gravity to calculate how quickly each participant grabbed the stick. We can also use distance scores as a proxy measure as we will do in this example, for simplicity.
The data we collected for this experiment is shown in the following table:
| Participant ID | Age in Years | Sex | Reaction time Score |
| 1 | 21 | M | 2.3 |
| 2 | 21 | F | 3.2 |
| 3 | 22 | M | 4.2 |
| 4 | 21 | F | 2.4 |
| 5 | 23 | M | 5.8 |
| 6 | 20 | F | 4.3 |
| 7 | 21 | M | 3.6 |
| 8 | 21 | F | 5.4 |
| 9 | 21 | M | 7.5 |
| 10 | 21 | F | 1.2 |
Table 8.1 Sideline Drop stick Test data for Annotated Practice Example 1
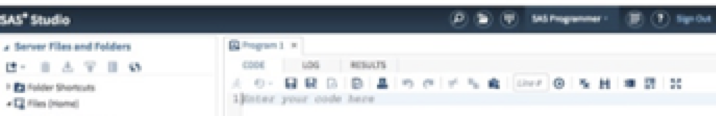
Figure 8.4 SAS Studio editor space in SAS University Edition
How to Write the SAS Program
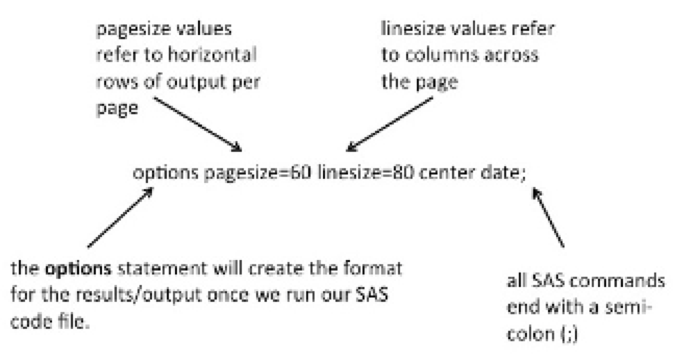
- The first line we enter into our SAS program is the options statement. The options statement tells SAS how to report the results in the output file. Notice that every SAS command statement ends with a semi-colon (;). This is required to tell SAS that the command is complete – remember, SAS is not magic! You are the programmer (aka coder) and so you need to tell the program what to do.
options pagesize=60 linesize=80 center date;
The SAS CODE explained.
- In line 2 of the program, we name the workspace. Naming the workspace is important so that we can recycle our code and reuse features of programs that we have already written. In other words, you don’t have to start from scratch every time you use SAS. How awesome is that!? To name the workspace use the data command shown here as:
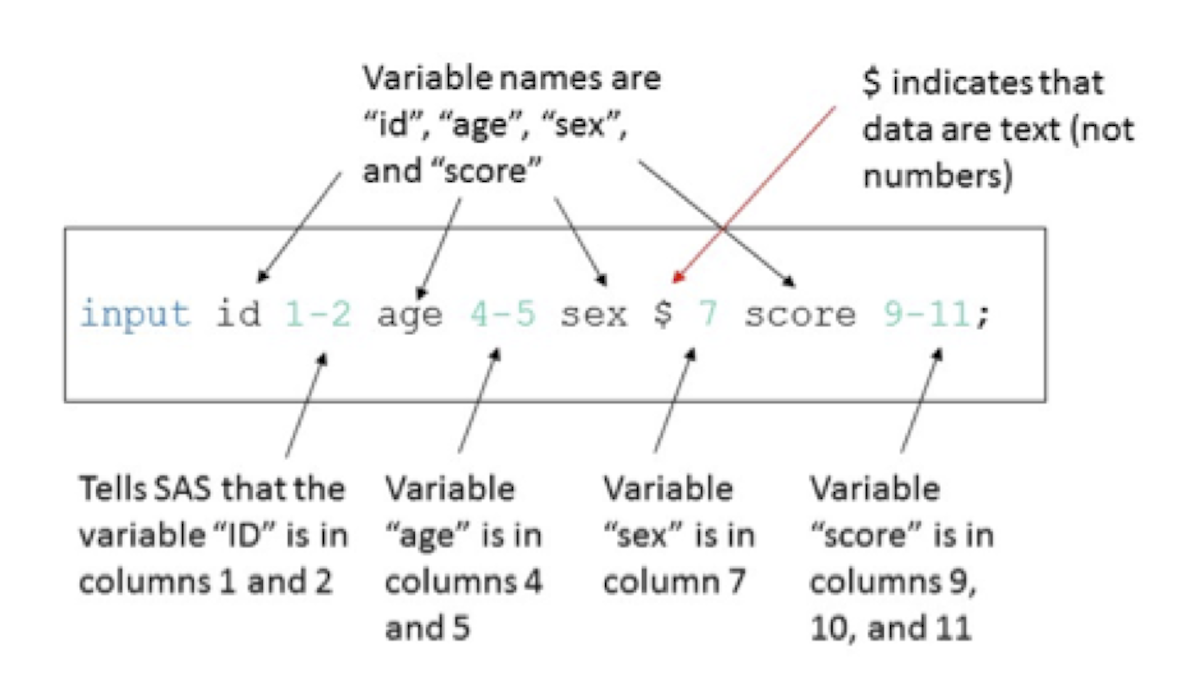
- Next, we use the input command to tell SAS where each variable is located in our code file and whether the data are numeric or include text characters (i.e., letters or words). First we type the word INPUT. In SAS we have an entire lexicon of key words that invoke specific functions. INPUT is a KEYWORD that lets the SAS engine know that the text that follows identifies the column headings (aka variable names) the variable types and the width of the column that holds the data for the variable
Recall that our data set for the reaction time test included the following variables: participant’s id, age, sex, and reaction time test score. After each variable name, we provide the column numbers where the values for that variable are located. To indicate that a variable includes text characters add a dollar sign $ after the variable name. Don’t forget to include a semi-colon at the end!
INPUT ID 1-2 AGE 4-5 SEX $ 7 SCORE 9-11;
- Next we can add a label statement that will help SAS understand the names of the variables that we used in the SAS program.
LABEL ID=’PARTICIPANT ID’
SCORE=’REACTION TEST SCORE’;
These first few lines of SAS code set up the input environment. There are more commands that we can add in this section, but for now, these are sufficient to enable us to conduct a simple analysis of our data.
- Our next step is to provide the data that SAS will analyze. For this practice example, we will type the data into our SAS code file. In later exercises, we will use external datasets that are saved as separate files and tell SAS where to find it.
The data entry paragraph begins with the command data lines;[1].
This command is followed by the data set organized according to the column format that you specified in the input statement above. A semi-colon closes the data paragraph, and the data paragraph is followed by the run; statement.
DATALINES;
01 21 M 2.3
02 21 F 3.2
03 22 F 4.2
04 21 F 2.4
05 23 F 5.8
06 20 F 4.3
07 21 F 3.6
08 21 F 5.4
09 21 M 7.5
10 21 F 1.2
;
The image below illustrates the program up to this point. So far in this program, we have used the following SAS KEYWORDS: DATA, INPUT, LABEL, and DATALINES. Notice also that each SAS COMMAND ends with a semi-colon (;).
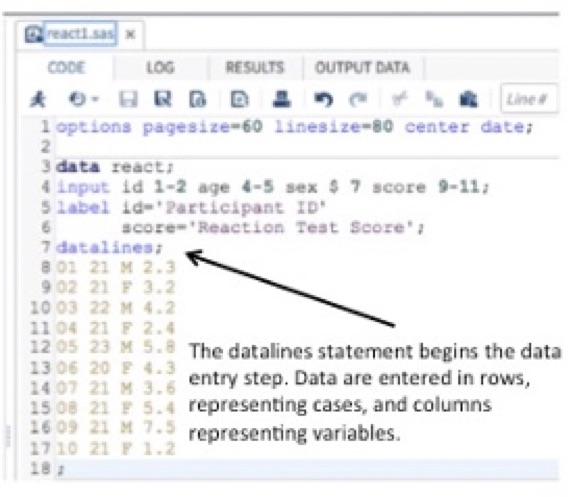
Figure 8.5 How your SAS code file should look
Notice the structure of the program. The code itself does not necessarily need to begin in column 1. This is because SAS begins reading at the start of a command line and ends reading when it reaches a semi-colon. However, the data are intentionally lined up in the left-hand margin, as the column position of the data is important. Correct arrangement and location of the data is essential in order for your program to work properly.
- Be sure to save the code by clicking on the save as icon (it looks like an old-school floppy disk with a pen on it). In SAS there are different ways to store files but there is no auto-save so if you exit the program without saving you will lose your work. For the most part, the storage/saving of a file is similar to that which you would use in any end-user application (like a word processor or spreadsheet application).
If this is the first time saving this SAS file, then click the SAVE_AS icon shown here:
If you are saving an updated version of the file instead, click the SAVE icon:
For this practice example, save the file as react1.sas in your folder space.
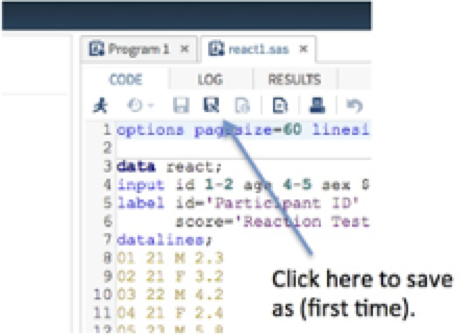
Figure 8.6 Using the SAVE-AS feature in the SAS program editor
Later, you can retrieve the saved file by locating the file name in your SAS folders. Just select the file and then double click to open the file in your SAS editor.
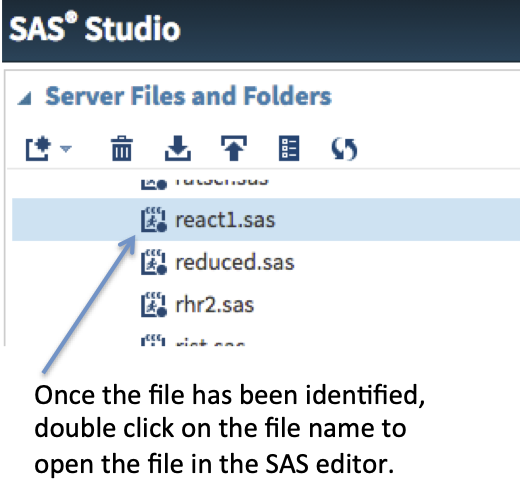
Figure 8.7 Retrieving a saved file for use in the SAS program editor
Now that the data is entered and your file is saved we can tell SAS to analyze the data. To do this we write SAS commands that tell the program what to do with the data. These are procedural statements so they each begin with the word proc (pronounced as “prock”).
- The first thing we want to do is to sort the data so we use the following command: proc sort.
So, what are we sorting? Well, we are sorting the data we entered by hand from our reaction test experiment. Recall that the name we gave to the working file was react, because it represented the reaction test scores for a group of participants.
Let’s begin by sorting the data by sex and produce a printout of the data we entered. First we write proc sort which tells SAS to sort the data. Then we write data=react; to tell SAS which data we want it to sort. Finally, we tell it how to sort the data by using the word by + the name of the variable to sort on (in this case, sex).
PROC SORT DATA=REACT; BY SEX;
PROC PRINT; VAR ID AGE SEX SCORE;
- Let’s also compute some basic descriptive statistics on this data using the proq freq command and the tables command to produce a frequency table to count the number of females and the number of males in our data set. Shown here:
PROC FREQ; TABLES SEX;
- We also want to look at the average scores for the reaction test in the total group. To do this we first use the proc univariate; command which will tell SAS to provide descriptive statistics. We are only interested in looking at the reaction test score so we indicate this by writing var + the name of the variable of interest (in this case, score).
PROC UNIVARIATE; VAR SCORE;
- Finally, let’s compare the average reaction test scores between male and female participants. To do this we repeat the line of code for the total group but we add a by statement which tells SAS to apply the procedure based on groupings identified by that variable (in this case, sex).
PROC UNIVARIATE; VAR SCORE; BY SEX;
Congratulations! Your first SAS program is complete and ready to run.
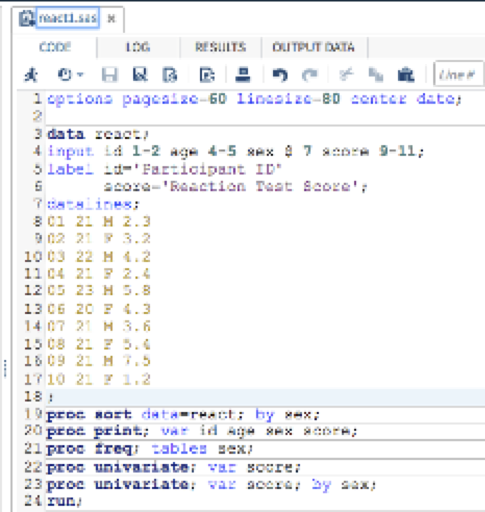
Figure 8.8. The complete program in the SAS program editor
Save the program again before you run it. Saving continuously reduces the risk of losing work as you write program code.
[1] In older versions of SAS the word cards was used instead of datalines. Notice that the command ends with a semi-colon.
