
Analysis of Non-Parametric Outcomes
25 Computing the Z Statistic for the One Sample Runs Test
Often in quantitative methods, we expect that any score we observe occurs at random and is not a result of selection bias. This expectation is of particular importance when we are dealing with strings of binary events, such as viewing the change in a particular measure over time or counting the sequence of similar outcomes without a break.
Wald and Wolfowitz referred to such strings or sequences of similar events as runs. A run is defined as a sequence of similar data values. A run of an event occurs when a particular outcome of interest is observed within a sampling space. A run can have a sequence of 1 or a run can have a sequence of > 1.
For example, consider the toss of a fair coin. If we toss the coin 20 times we could expect to observe the following extreme outcomes:
- H,T,H,T,H,T,H,T,H,T,H,T,H,T,H,T,H,T,H,T
- H,H,H,H,H,H,H,H,H,H,T,T,T,T,T,T,T,T,T,T
In the first sample space above (1), the outcome was a complete interspersing of each toss of H followed by a T (or T followed by H). In the second sample space above (2) we observe the complete clumping of ten heads followed by ten tails, both of these events can be considered random, but they represent the extremes of what we might observe.
Consider that the purpose of the runs test is to determine, within a string of events, the randomness of fluctuations. That is, do the observed fluctuations (if any) occur at random or do the fluctuations of observations exhibit some form of clumping together? Does the sequence observed within a sampling space represent a pattern over a given sampling space or period of time.
The formula for the runs z-statistic is shown here:
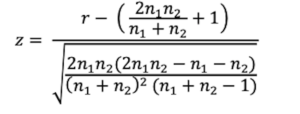
There are three parts to the z formula for the One Sample Runs Test.
1) The first part is to count the number of runs of a given type of events. For example, in the coin toss example, there were 20 tosses of a fair coin, which resulted in 10 runs as shown here:
H, T, T, T, H, T, H, H, T, H, H, H, T, T, H, H, H, H, T, T
2) The second part is to compute the mean number of expected runs using the formula:
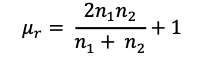
In this scenario, there were 21 reported outcomes whereby we consider the number of heads were counted as n1 and the number of tails were counted as n2, so that n1=11 and n2=9.
![]()
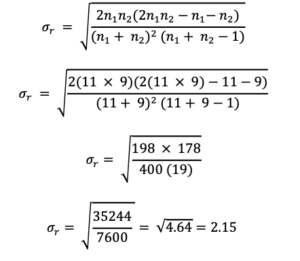
3) The third part of the calculation is to compute the standard deviation of the estimate of runs using the formula:
4) the calculation of z for the runs test is then simplified to: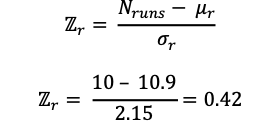
The evaluation of runs of events is a z test, which means that the evaluation of the null hypothesis associated with this test is based on a normal (z) distribution.
The value of z = 0.42 is within the region of acceptance of the null hypothesis, as shown with this graph. The null hypothesis: is accepted if the z observed > -1.96 and <1.96.
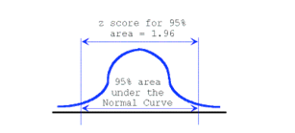
Therefore, we accept the null hypothesis that there is no pattern or sequence to THIS toss of a fair coin.
Your Turn: Compute the One Sample Runs Test
Consider the runs of increases and decreases in the daily weather pattern for one month in the seaside Village of Cavendish, Prince Edward Island. A run is defined as a sequence of similar data values. The sequence can be a single entry, or a string of entries occupying the entire set of observations. Since you are a golfer, who likes to play when the weather is hot, you hope that there is only one run and that it is a positive increase to warmer weather each day.
Use the approach explained for the “one sample runs test” to compute the significance of the runs of temperatures in the following example. In your response state the null hypothesis for this question, and in addition to the results of your computations, include a statement about your decision of whether to accept or reject the null hypothesis.
Data Set #3 One sample runs test data for the month of July
| Date & Temperature | Change | Date & Temperature | Change |
| June 30th 20º C | · | July 16th 20º C | – |
| July 1st 21º C | + | July 17th 21º C | + |
| July 2nd 22º C | + | July 18th 22º C | + |
| July 3rd 22.5º C | + | July 19th 23º C | + |
| July 4th 23º C | + | July 20th 25º C | + |
| July 5th 24º C | + | July 21st 23º C | – |
| July 6th 25º C | + | July 22nd 23.5º C | + |
| July 7th 26º C | + | July 23rd 22º C | – |
| July 8th 24º C | – | July 24th 21º C | – |
| July 9th 21º C | – | July 25th 20º C | – |
| July 10th 19º C | – | July 26th 24º C | + |
| July 11th 18º C | – | July 27th 25º C | + |
| July 12th 21º C | + | July 28th 26º C | + |
| July 13th 22º C | + | July 29th 27º C | + |
| July 14th 22.5º C | + | July 30th 25º C | – |
| July 15th 21º C | – | July 31st 24º C | – |
| Null hypothesis | Average run
mr |
Standard deviation
(sr) |
Z runs test | Decision concerning the null hypothesis |
