
Basic Principles
4 Thinking Statistically About Your Research
Essential Design Considerations
Thinking statistically means being able to identify real-life examples of data and consider the following questions: Data are everywhere, but do we recognize data? How do we give meaning to the data around us? How do we provide context for data? How do we make data relevant to us or to others?
While the focus of this book is on analyzing quantitative data, we also need to consider other forms of data that help us to recognize behaviours, attitudes, outcomes, and patterns that can lead to predictions of future outcomes or behaviours. Recognizing data, thinking about data patterns and the connectivity of information, and providing structure to data sources are important exercises. These are the kinds of exercises that underlie the questions that give value to statistical enquiry. These are the thought processes that can help us generate new ways of thinking and new applications from existing data.
In an earlier study[1], we considered a famous quote by T.S. Eliot from 1962: “Where is the wisdom we have lost in knowledge? Where is the knowledge we have lost in information?” This is the fundamental construct of a constructivist paradigm approach to developing knowledge and action. In our mapping exercise, we explained that using a constructivist paradigm we begin with raw data, contextualize the data, apply the data to a set of rules, a rubric, a plan, an algorithm, a taxonomy, and eventually create a product, a process, a policy.
Figure 4.1 of the Constructivist Perspective for the Flow of Facts to Learning
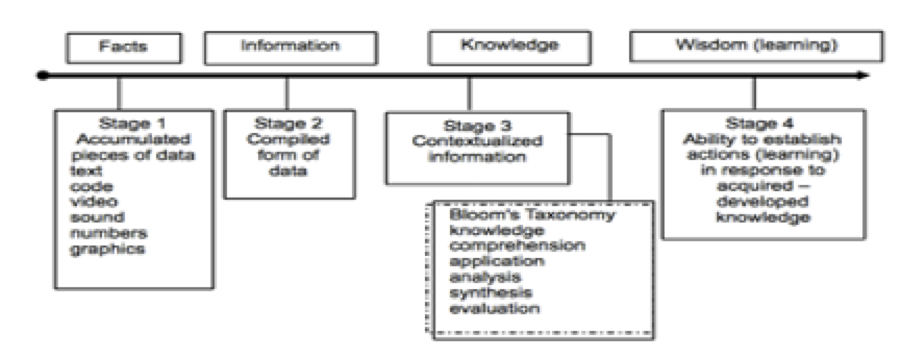
A constructivist paradigm approach was used to develop the material presented in the following chapters. Data are contextualized – referenced to various scenarios and processed using SAS programming statements. This process enables us as researchers to make sense of the data, thereby forming the evidence for knowledge synthesis. This new knowledge can then be used in specific actions like policy development or policy evaluation.
The Research Process
We conduct research for a variety of reasons such as:
- to describe a phenomenon
- to evaluate outcomes
- to evaluate diagnostic testing
- to evaluate screening procedures
- to determine cause-effect relationships
- to describe a disease, prevalence and natural history
- to determine a prognosis
- to review existing practice
- to evaluate the effectiveness of interventions.
Phase 1: Conceptual Work
First, we do the conceptual work needed to develop a research problem and identify potential approaches to addressing it or understanding it better. We review the related literature to support our rationale for conducting the study, establish a clear statement of the problem, and identify a target population from which we will select an accessible sample.
In this phase we also identify and clarify each variable in our study, paying close attention to their conceptual definitions. This helps ensure that we select appropriate measures that actually measure the concepts we want to measure (you’d be surprised how often there is a mismatch between what people say they are measuring and what they actually measure!).
Last, but certainly not least, in the conceptual work phase we develop a logical, theory-informed model of how we think variables are related to one another. The relationships that we propose between variables are called hypotheses and will be tested using statistics after we collect our data. It is important to note that there is not just one way to approach a research problem and sometimes several possible theories could be used. It is up to the researcher to think critically, evaluate past evidence, and decide what makes the most sense.
For example, we might be interested in helping people stop smoking.
To do this we could develop an intervention based on Bandura’s (YEAR) self-efficacy theory. According to this theory, people’s behavior is influenced by their confidence that they will successfully be able to engage in that behavior and their outcome expectations (i.e., what they think will happen if they engage in that behaviour). Therefore we would plan an intervention that will improve self-efficacy to quit smoking and provide information about the benefits of quitting smoking. We would later use statistics to test whether our intervention improved participant’s self-efficacy to quit smoking, and perhaps, whether increased self-efficacy, in turn, led to actual changes in behavior (i.e., did they stop smoking?).
Alternatively, we could evaluate the effectiveness of a drug or health product such as nicotine gum on smoking cessation. In this case, the theory to inform the study might be more physiological, centring on the effects of nicotine on the body as well as the benefits of not inhaling cigarette smoke.
These are just two ways that you could address the research problem (how do we help people stop smoking?) and there are many more! Both are equally valid but they take different angles. The thing you want avoid though it collecting data BEFORE you do this crucial conceptual work. Even if you are working with secondary data (i.e., data that someone else collected), the last thing you want to do is “go fishing” and simply run statistics until you find something significant.
Phase 2: Study Design & Planning
After you’ve decided what the research problem is, the variables and relationships of interest, and your hypotheses, you design the study and create a plan to conduct the research. This involves selecting the appropriate methods needed to answer our research questions outlined in Phase 1. We decide which study design makes the most sense to test our hypotheses of interest. For example, should the study be cross-sectional or longitudinal? Are you going to compare groups? Are you doing an observational study or an intervention? There are many choices here and they will influence the statistics that you are able to do so choose wisely. For example, if you want to compare groups using a t-test, you need to have data for the same variables from the two different groups you want to compare. Seems obvious, right?
The point is that your statistical analysis actually begins well before you are anywhere close to writing your first SAS command. You need to know what hypotheses you are going to be testing in order to know what statistical tests you will need to run. And, you need to know what statistical tests you plan to run in order to calculate your anticipated effect size (which is always specific to a particular statistical test) and sample size which is a vital step for planning your recruitment and data collection plan.
Creating a data analysis plan is an integral part of creating a well-designed research study. It should describe:
- Your plan for assessing and dealing with missing data
- What statistical tests you will be using to evaluate the reliability and validity of your measures
- What statistical tests you will be using to test your hypotheses (including post-hoc tests, if applicable) and how you will examine the underlying assumptions of those tests
- What software program you are using (SAS)
- The significance (alpha) level used (or model fit statistics if appropriate)
Phase 3: Research Implementation
After you have developed your research plan and obtain ethics approval, it is finally time to do the study! This is one of the most exciting parts of research and where all of your hard work and energy spent in the conceptual and planning phases pay off.
If you have time and the resources to do so, it is usually a good idea to pilot test your research protocol on a small group of people before you roll it out on a large scale. This allows you to work out any potential kinks, catch typos, and assess the feasibility of what you are planning to do. In the long run, this can save you a lot of time and energy and will help ensure that you get the data that you want.
Phase 4: Analysis & Interpretation
Once you have collected your data, you can move on to the data analysis phase. This is the central focus of this book but hopefully, you can see why data analysis is not a stand-alone part of doing research. All phases of the research process work together and quite frankly, just because you find significant results using a statistical test doesn’t mean that they are important or meaningful.
In the data analysis phase, you analyze your data using the plan that you developed in phase 2. However, it is often the case that you need to make decisions to deal with the imperfections of real data. More often than not you will have data with missing values or variables that don’t meet the underlying assumptions of the test you planned to do. For this reason, it can be helpful to keep a research journal or log outlining all of your data analysis and findings and the decisions that you make along the way so that you remember why you changed your plan and have evidence to support your choices. If you are a novice researcher it is also a good idea to consult with your supervisor or a more experienced researcher with statistical expertise. Being well-organized and being able to show them exactly what you did and why will make it easier for them to help you.
After you finalize your results, you need to report them systematically and can include graphs and tables to summarize essential information. Interpretation of the results involves deciding whether or not they support your hypotheses and situating your findings within the current evidence relevant to your research problem. This includes discussing your results in light of previous research and with regard to similarities or differences to previous research and then conclusions are stated about the knowledge gained by conducting this research.
Phase 5: Dissemination
The final phase of any research project is the dissemination of the findings to stakeholders, which simply means people who have a “stake” or interest in the results. For example, your research on smoking cessation would affect people who smoke cigarettes, their loved ones, the health care system, store owners of stores that sell cigarettes, tobacco companies, and tobacco farmers, to name a few. Strategies and media used to disseminate new knowledge are diverse and can range from more traditional approaches such as conference presentations and peer-reviewed journal articles to more modern ones like infographics tailored to social media platforms or webinars with stakeholders.
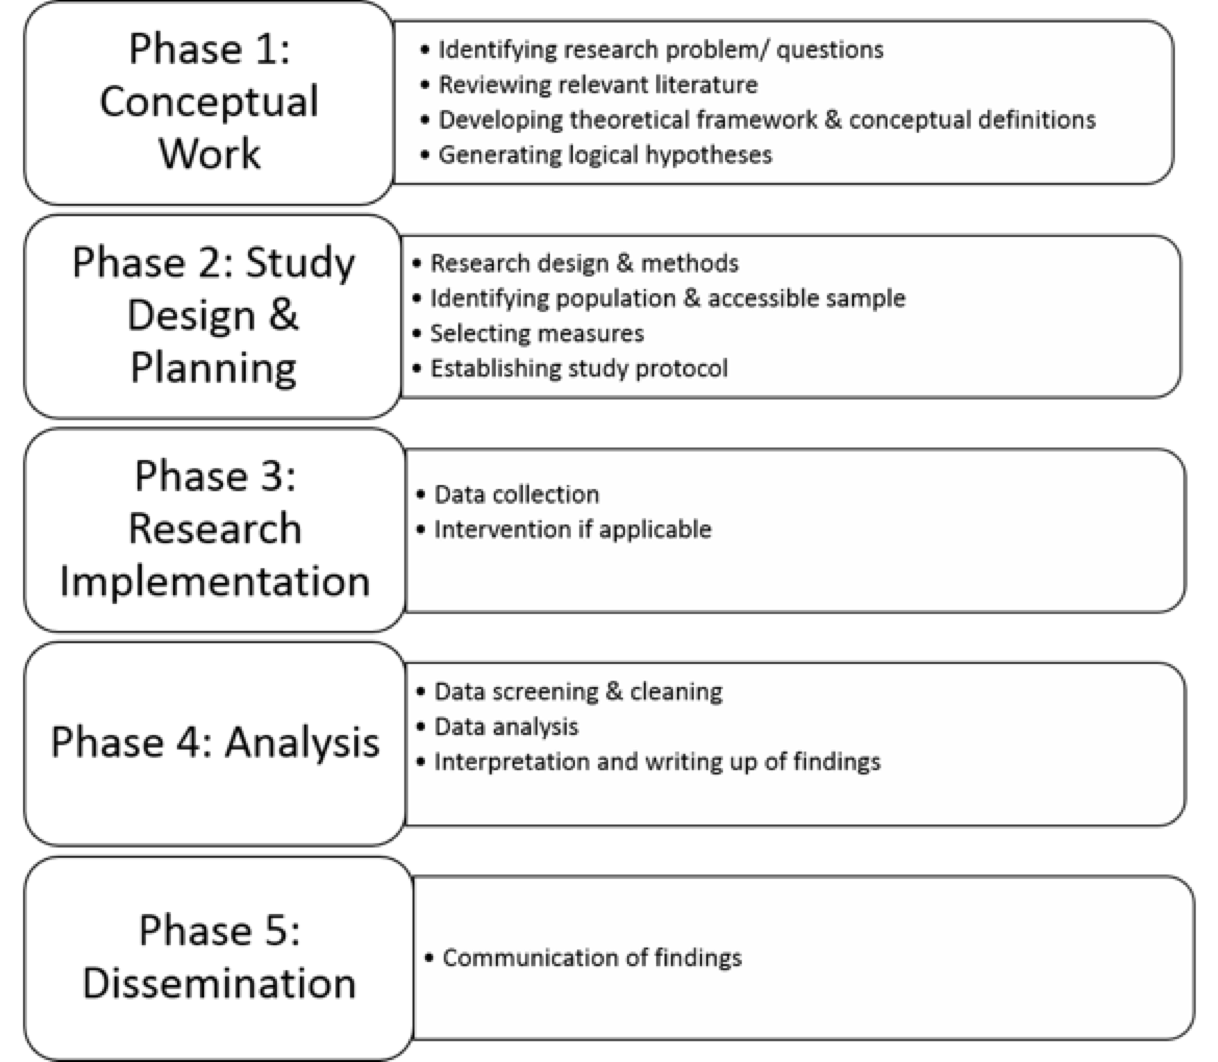
Figure of The Research Process for a Quantitative Research Project
[1] Montelpare, W.J., and Williams, A.M., (2000) Web-Based Learning: Challenges in using the internet in the undergraduate curriculum. Education Information Technology, Volume 5(2), pp. 85-101.
