
Basic Principles
3 All About Variables
Defining a Variable
As noted previously, variables are central to the application of statistics in research. That is, variables hold the data to which the statistical tests and methods are applied. Variables are the containers that we use to collect, organize and process data.
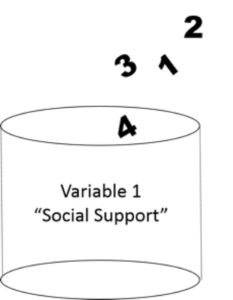
Representation of the variable “Social Support” as a container that holds values.
The values held by the container (variable) represent the data that was reported for the measure of interest in the sample. Before we move on it is essential to understand both the conceptual definition and the operational definition of each variable in your dataset (or planned study if you are collecting your own data).
A conceptual definition refers to the abstract idea or theoretical meaning of interest (Polit & Beck, 2012). Many concepts are defined in multiple ways so it is important to clearly identify which conceptual definition you are using in your research. For example, the concept of social support can be defined as perceived support, support actually received, emotional support, informational support, and social connections. Though similar, each of these conceptual definitions are distinct. Be careful to ensure that you know exactly the concepts of interest within your research.
In contrast, an operational definition refers to how you are going to measure the concept of interest (Polit & Beck, 2012). Using our example above, if we decide that we are interested in perceived social support, then we would want to use an instrument that measures perceived social support specifically. We would not want to use an instrument that measures social connections or received support, or something else.
Another example that illustrates the difference and links between a conceptual and operational definition is applying them to the concept of body height. The conceptual definition of height is how tall your body is. The operational definition of height is how long your body is from your feet to the top of your head in cm or inches. Measuring the length of a person’s body from head to toe creates a value that represents how tall that person is. That value can then be put into your height container or variable in your dataset for analysis.
Types of Variables
The values held by variable containers can be either fixed or they can change. That is, they can vary (that’s right, variables (noun) can be variable (adjective)!). A random variable is a variable that can take on any value.
There are two types of random variables:
Discrete random variables – these have finite values, typically based on the whole number line (1, 2, 3…etc.).
Discrete random variables can represent counts or categories. Some examples of discrete random variables include classification of sex as male, female, or other; the number of symptoms reported; the number of guests at a resort; the number of airlines using a specific terminal; the number of cavities for a patient, an individual’s socio-economic status (SES); disease state — classification as a case or non-case; and age category in years.
Continuous random variables – these can have an infinite number of values since continuous random variables use the continuous measurement scale based on the REAL number line to record outcomes (0, 1, 1.1, 1.2, etc.).
Examples of continuous random variables include time, distance, velocity (which is computed from distance ÷ time and reported in km/hr), body weight (reported in kg), oxygen consumption (reported as ml/kg•min-1), and pharmaceutical prescription (sometimes denoted as mg per 100 grams body weight). Notice in the description of discrete variables we refer to the measurement unit as a whole number or as an integer value (no decimals) while the reference to continuous variables often describe rates or ratios where the measurement can include a decimal value and is often described as a fraction.
Creating New Categorical Variables
After determining whether the measurement is either a discrete or continuous random variable we can group our data to produce new variables that can also take on specific or discrete boundaries. The result is a set of variables, which produce categories of items. The term for a variable, which is used to organize data, is a “categorical variable”. The categorical variables are used to group results or measurements into sub-classifications so that specific statistical analyses can be performed on each of the sub-classifications within the categorical variable.
For example, we could use age measured as a continuous variable to create age categories. In Figure 1.6 you can see how this might be done. Note that you always have less information in the categorical variable than the continuous variable. Keep this in mind. If you ask participants to select their age category that is the maximum amount of information you will have about their age. If instead, you ask them for their exact age you can still create categories later if desired.
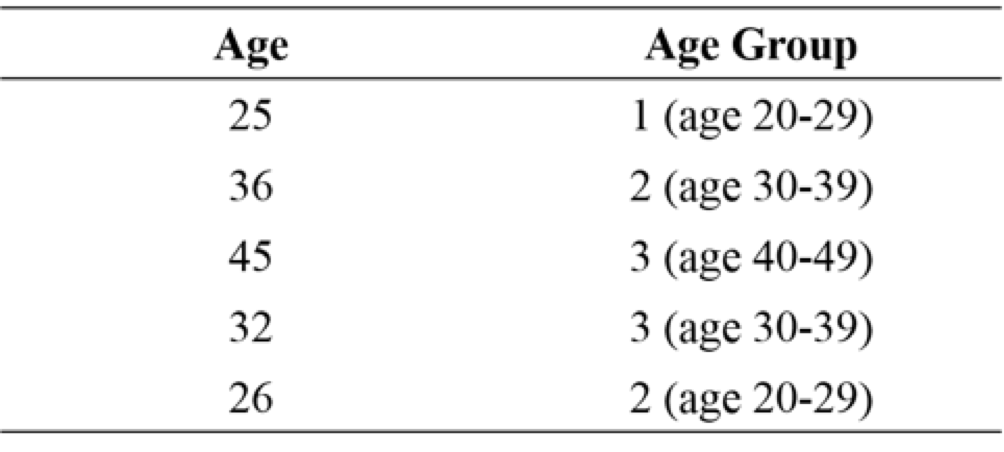
Example of creating a categorical variable from a continuous variable
Independent versus Dependent Variables
Research studies can take on several different design types. Some are purely descriptive, some are correlational and some are comparative. However, many research studies are designed to prove cause and effect relationships between variables.
Cause (Input) –> Effect (Outcome)
Input variables are often referred to as independent variables. In experimental research, these can be controlled and are typically categorical or organizing variables. Often the independent variables are called the intervention or predictor variables. Outcome variables are often called dependent variables because they depend on the influence of the independent variables. Throughout this text we will explore the application of statistical analyses to variables of different types within research designs that collect measures with different considerations for the role of variables.
Here is what we covered in this section
Here you were introduced to:
- The different types of research variables that are essential to creating a statistical analysis.
- The concepts of thinking statistically and creating a process before embarking on the research.
In several examples, we will generate data for our examples using random number generators. The SAS program provides a powerful platform for creating computer simulations that can demonstrate potential outcomes.
