
SAS Programming
9 Running a SAS Program
In case you are new to programming, a SAS program simply refers to several lines of code that you wrote (like in our practice example about reaction time test scores). We are not referring to the entire SAS software program!
To run your program and generate results, click the running person icon.  located at the top of the editor page.
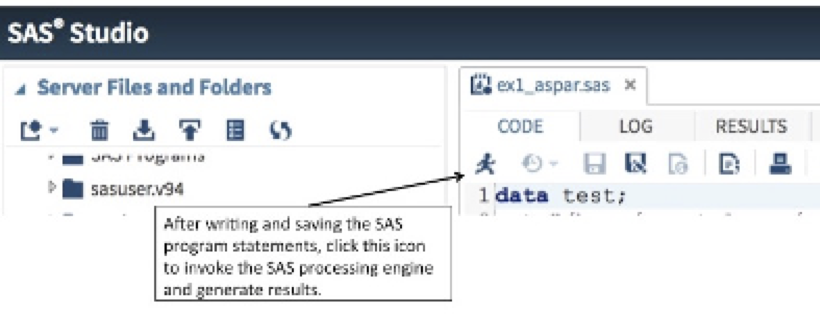
Click the running person icon to invoke the SAS processing engine
In our first submission, we asked to sort the data and then create a printout of the data. The specific program statements are:
PROC SORT DATA = SAMPLE.REACT; BY SEX;
PROC PRINT; VAR ID AGE SEX SCORE;
| Obs | id | age | sex | score |
| 1 | 2 | 21 | F | 3.2 |
| 2 | 4 | 21 | F | 2.4 |
| 3 | 6 | 20 | F | 4.3 |
| 4 | 8 | 21 | F | 5.4 |
| 5 | 10 | 21 | F | 1.2 |
| 6 | 1 | 21 | M | 2.3 |
| 7 | 3 | 22 | M | 4.2 |
| 8 | 5 | 23 | M | 5.8 |
| 9 | 7 | 21 | M | 3.6 |
| 10 | 9 | 21 | M | 7.5 |
Notice in our RESULTS that the data have been re-organized (sorted, if you will) from what was entered initially. As a result of the PROC SORT command. The data are now organized by sex, whereby the data for the females is entered first and the data for the males follows (because F precedes M in the alphabet).
The next SAS command asked the SAS engine to calculate the number of males and the number of females in the data set. The PROC FREQ command used here produced a frequency distribution table for the data organized BY SEX;
The result of the PROC FREQ; TABLES SEX; command is shown below.
| sex | Frequency | Percent | Cumulative Frequency |
Cumulative Percent |
| F | 5 | 50.00 | 5 | 50.00 |
| M | 5 | 50.00 | 10 | 100.00 |
Our next SAS commands will produce descriptive statistics for the continuous variable reaction test score. We can process this variable first for the whole group and then for the separate subgroups of males and females. Notice that the SAS commands are all written in upper case. Using uppercase text is not required but is considered good SAS programming style.
PROC UNIVARIATE; VAR SCORE;
PROC UNIVARIATE; VAR SCORE; BY SEX;
Several important measures can be generated from the PROC UNIVARIATE procedure as we will see later in the text. Below is a simple summary from the descriptive statistics for the total group
The UNIVARIATE Procedure
Variable: score (Reaction Test Score)
Our next SAS commands will produce descriptive statistics for the continuous variable reaction test score. We can process this variable first for the whole group and then for the separate subgroups of males and females. Notice that the SAS commands are all written in upper case. Using uppercase text is not required but is considered good SAS programming style.
PROC UNIVARIATE; VAR SCORE;
PROC UNIVARIATE; VAR SCORE; BY SEX;
Several important measures can be generated from the PROC UNIVARIATE procedure as we will see later in the text. Below is a simple summary from the descriptive statistics for the total group
The UNIVARIATE Procedure –> Variable: score (Reaction Test Score)
| Moments | |||
| N | 10 | Sum Weights | 10 |
| Mean | 3.99 | Sum Observations | 39.9 |
| Std Deviation | 1.87584055 | Variance | 3.51877778 |
| Skewness | 0.43975108 | Kurtosis | -0.0729366 |
| Uncorrected SS | 190.87 | Corrected SS | 31.669 |
| Coeff Variation | 47.0135477 | Std Error Mean | 0.59319287 |
The following tables show a simple summary from the descriptive statistics for the separate subgroups organized BY SEX results for females followed by results for males.
sex=F
| Moments | |||
| N | 5 | Sum Weights | 5 |
| Mean | 3.3 | Sum Observations | 16.5 |
| Std Deviation | 1.63095064 | Variance | 2.66 |
| Skewness | 0.02593164 | Kurtosis | -0.8358726 |
| Uncorrected SS | 65.09 | Corrected SS | 10.64 |
| Coeff Variation | 49.4227468 | Std Error Mean | 0.7293833 |
sex=M
| Moments | |||
| N | 5 | Sum Weights | 5 |
| Mean | 4.68 | Sum Observations | 23.4 |
| Std Deviation | 2.01668044 | Variance | 4.067 |
| Skewness | 0.45615378 | Kurtosis | -0.5702631 |
| Uncorrected SS | 125.78 | Corrected SS | 16.268 |
| Coeff Variation | 43.0914624 | Std Error Mean | 0.90188691 |
Recall that by clicking the SAS LOG tab in the SAS program editor, we can review the sequence of the steps SAS used to process the program file. The LOG file lists any notes, warnings or errors that you may have generated as a result of your program entry. If the LOG file is clean, that is without errors, then your listing file will show the output relative to the commands that you submitted. A portion of the output in the file for the reaction time test is shown below.
OPTIONS PAGESIZE=60 LINESIZE=80 CENTER DATE;
DATA REACT;
INPUT ID 1-2 AGE 4-5 SEX $ 7 SCORE 9-11;
LABEL ID=’PARTICIPANT ID’
SCORE=’REACTION TEST SCORE’;
DATALINES;
NOTE: The data set WORK.REACT has 10 observations and 4 variables.
NOTE: DATA statement used (Total process time):
real time 0.00 seconds
cpu time 0.00 seconds
PROC UNIVARIATE; VAR SCORE;
NOTE: PROCEDURE UNIVARIATE used (Total process time):
real time 0.13 seconds
cpu time 0.08 seconds
Observe the highlights
- In our data set we have four variables: The participant’s ID, their AGE, SEX, and their reaction test score (cm)
- There were 10 participants
- Three of the variables were recorded as numerals, 1 variable was recorded as an alpha-numeric value and denoted by the symbol $.
- The variable set can be summarized as: ID AGE SEX $ SCORE
- The measure of interest is SCORE
