
III. ASSEMBLING THE VISUAL IMAGE
25. SHAPES FROM LINES
An initial process transforms the point-by-point information arriving along the optic nerve axons into information about lines and edges in the retinal image.
By the 1950’s, it was recognized that points in the retinal image are sent to the visual cortex by optic nerve axons as 30 second and larger overlapping center-surround, on-off retinal fields. [1] (See that figure in Ch 20.) This indicated that our visual image was similar to a chemical film photograph – a mapped composition of spots sharpened by excitatory-inhibitory connections to the receptors of a retinal image.
In 1960, it became possible to record impulses from single neurons in the brain. However, efforts to find cells in the visual cortex sensitive to points of light from specific directions proved elusive. Then in 1962, a malfunction of their apparatus led David Hubel & Torsten Wiesel to a completely different insight into how the retinal image was handled in the cortex: They discovered that neurons in the primary visual cortex (V1) did not respond to either bright or dark spots on the retina. Rather, they responded to lines and edges at various specific angles (either dark lines on bright backgrounds or bright lines on dark backgrounds) in the retinal image. [2]
As was the case for the concentric color-opponent response of the optic nerve axons, retinal ganglion cells connect to arrays of photoreceptors – see Ch 20. The locations in the retinal image to which a neuron is connected is its receptive field. Neurons in the visual cortex have line and edge receptive fields because they are connected to hundreds of photoreceptors whose locations form a line or an edge across the retina. In turn, each retinal ganglion neuron’s axon has branches to hundreds of cortical neurons with partially overlapping linear receptive fields at different angles:
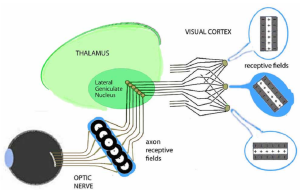 Small wonder that the visual cortex is the most complex region of the brain.
The encoding of images as lines rather than points further solves the problem of how detailed information in the retinal image can be more efficiently transmitted. For example, an image of 10,000 spots can be accurately represented by 500 line elements, with each element based on 20 spots.
Neurons in the primary visual cortex (V1) are organized by their retinal fields into separate columns for lines at different angles, location by location:
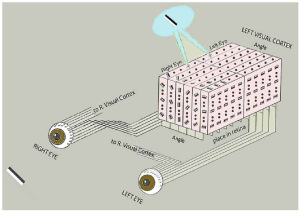
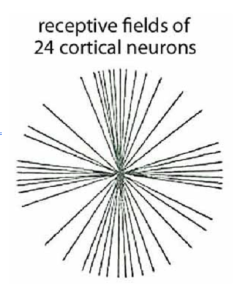
Subsequent experiments by Richard Mansfield and others found that primates had more visual cortex neurons sensitive to vertical and horizontal lines than neurons sensitive to other angles. [3]
This solved a puzzle about an effect previously noted by designers of visual displays: People can more precisely read dials when the pointer is near horizontal and vertical than at intermediate positions.
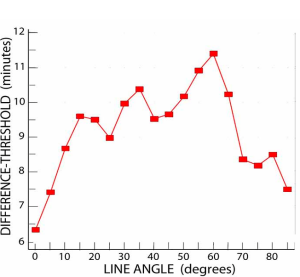
Here is an example of our ability to see differences in the angle of a line as a function of its orientation angle: [4] (a 1 minute angle = 1/60 of a degree)
At 0o (horizontal) and 90o (vertical), angular differences of about 7 minutes are noticeable. Lines oriented between 30o to70o need to be tilted about plus or minus 10 minutes for the difference to be noticeable.
A well-known illusion, the Poggendorf Effect, demonstrates how uncertainty about the angle of lines at 60o can lead to misperceptions:
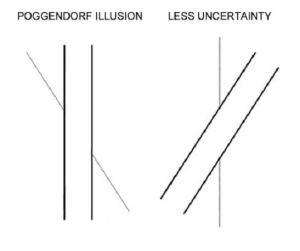
Despite appearances, you probably guessed that the two diagonal line segments in the left figure could be a covered single line. Uncertainty about their orientation results in some visual “averaging” of their position with the closest adjacent line.
There is less uncertainty about the vertical lines in the right figure. This minimizes the illusion of offset.
This demonstrates that the visual system operates on linear rather than point-by-point sensitivity.
More extensive proof of our linear visual processing comes from a non-invasive observational method:
Repeated stimulation of neurons depletes their ability to produce nerve impulses. If there are dedicated neural pathways or channels for a specific type of image, extended stimulation by that image results in a loss of sensitivity to it but not to other images. This selective adaptation method is comparable to recording from those pathways using microelectrodes.
The following demonstration uses selective adaptation to show that you have neural channels specifically tuned to lines oriented at various angles. To enhance the effect, sets of parallel lines called gratings are used instead of single lines. (Shortly we’ll see another reason for using gratings.) Some viewing distances may work better depending on your screen size.
1. Note that the upper and lower sets of lines on the right are the same.
2. Stare at the horizontal mid-line on the left.
3. Allow your eyes to look back and forth along that line – no where else.
4. After 1 minute, switch to look at the spot between the two pictures on the right. [5]
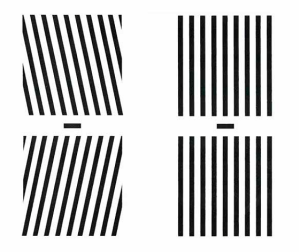 (Staring at the left pair of line patterns, fatigues neurons tuned to their respective opposite tilts. When you switch to the pair on the right, the lack of response from those neurons briefly tilts their images oppositely.)
The following pages explain how this illusion arises as a consequence of the visual system using population encoding to sense and transmit highly detailed information using a limited number of sensors and neural channels.
(Don’t skip. It is essential to forming a picture-in-your-head.)
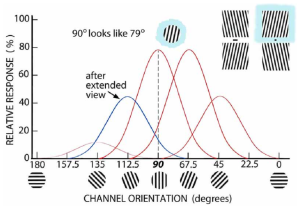
The following model represents the situation when you look at the vertical lines on the previous page. Shown are the relative responses of five orientation-tuned channels selectively sensitive to 135o, 112.5o, … & 45o. Channels on either side of the 90o channel also respond somewhat to the 90o grating, but more weakly. These weaker responses tend to balance each other, and the composite output (population encoding) maximizes at 90o, resulting in an accurate image of vertical lines.
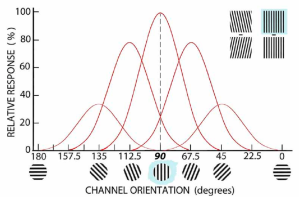 When you looked at the 112.5o tilted lines in the upper left of the above figure, those angle-tuned channels responded as follows: The channel tuned to 112.5o has the strongest response together with weaker responses in the other channels. The responses in those other channels balance, and the composite response is maximum at 112.5o.
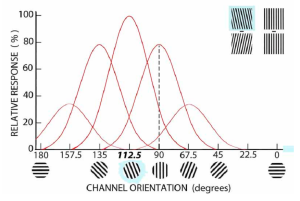 Extended viewing of the 112.5o grading depletes the neurotransmitter resources of neurons in that channel. This weakens its response. Since the 90o channel is also somewhat sensitive to 112.5o, its response is a bit weakened too.
When you then look at the 90o grating, the composite output of all channels thus ends up being maximal between 90o and 67.5o. This briefly gives the 90o grating an “inferred” orientation of lines at 79o – even though there is no channel maximally sensitive to that angle. (We rarely stare at specific simple patterns like this. So, the deception’s survival risk is negligible, but the benefits are great.)
It’s another illusion – albeit temporary!
 As shown in the figure in Ch 25, we can visually discriminate 6 to 12 minute differences in linear angles, depending on the angle. Obtaining that accuracy using channels with a narrow angular sensitivity would require some 900 to 1800 cells just for that specific retinal location (or in that viewing direction) to cover all discriminable line angles between 0 and 180 degrees.
Lacking the room for so many narrowly-tuned linear orientation channels, the visual system uses another approach. It is based on relatively few, broadly-tuned orientation channels. [6] Instead of sensing orientation from whichever channel responds most, it uses a composite of responses from all channels simultaneously – a method called population encoding.
Sensing any angle of a line using the composite response of a few broadly tuned channels provides both fine discrimination and an economy of neural channels to convey the information. Given the nearly infinite number of potential retinal image details to process, this efficiency enables distributing the information more widely in the brain. This might be more important to achieving a visual image than the details.
This approach is similar to how we discriminate about 150 photon wavelengths as hues using just three broadly-tuned cone photoreceptors at each retinal location (see Ch 17) rather than using a myriad of narrowly-tuned wavelength-sensitive receptors. That’s why you have no neurons in the visual cortex that respond selectively to orange, lime or violet. You don’t need them!
A similar strategy is also used in other sensory systems to achieve a wide range of sensitivity with good discrimination using relatively few broadly-tuned receptor channels. For example, we sense the angular position of a limb in its socket using relatively few pressure sensors in the cartilage lining. (Because such sensors can’t be sharply focused, they may be where this encoding began.)
Population encoding enables relatively few neural channels to extract many times their number of possible details in a retinal image. Shortly we shall consider a third type of population encoding whereby visual images arise from lines.
Subsequent recordings in secondary and tertiary (V2 &V3) visual areas found neurons tuned to more complex patterns in the retinal image. (Any retinal pattern to which a neuron or channel is tuned is called its receptive field.) These included receptive fields composed of two lines intersecting at a certain angle oriented in a specific direction, fields with lines of a certain length – not longer or shorter, and fields that encompassed a range of locations for an edge oriented at a specific angle.
A ”Coloring Book” Model of How Images of Shapes Are Formed
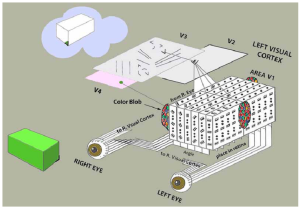
These findings gave rise to theories that our visual image arose from a “coloring book” process with objects composed of assemblies of lines and angles.
Shapes are obtained by connecting the neurons whose linear receptive fields were activated:
Subsequently, it was discovered that local color information is processed separately in neural clusters called blobs.
Consistent with a “coloring book” model, color information is filled in at a later stage of visual processing.
- Kuffler SW (1953) Discharge patterns and functional organization of mammalian retina, Journal of Neurophysiology, 16, 37-68. ↵
- Hubel DH & Weisel TN (1962) Receptive fields, binocular interaction and functional architecture in the cat’s visual cortex. Journal of Physiology, 160, 106-154. They and others subsequently found the same results in monkeys. This video tells the story of how they discovered line receptor neurons in the visual cortex: {https://www.google.com/search?client=firefox-b-d&q=Hubel & Weisel video#fpstate= Ive&vld=cid:b81913c3,vid:IOHayh06LJ4}. ↵
- Mansfield RJW (1974) Neural basis of orientation preference in primates. Science, 186, 1133-1135. ↵
- Nilsson TH (2020) What came out of visual memory: Inferences from difference-thresholds, Attention, Perception & Psychophysics, 82, 2963-2984. ↵
- This figure demonstrates that our visual system has neural channels that are selectively sensitive (i.e. “tuned”) to lines tilted at specific angles. At first glance, the right upper and lower sets of bars look the same. After staring at the left sets of bars for a minute, the right bars are no longer the same. They appear tilted in a direction opposite the tilt of their counterpart set to the left. The subsequent pages explain why the lines on the right shift in appearance after staring at the lines on the left. ↵
- The number of orientation-tuned channels has proven difficult to measure because their bandwidth varies (Taylor C, Bennet PJ & Sekular AB, 2014, Evidence for adjustable bandwidth orientation channels. Frontiers of Psychology, 5, https://doi.org/10.3389/fpsyg.2014.00578). For direct evidence of population encoding in the primate visual cortex: Victor JD, et al. (1994) Population encoding of spatial frequency, orientation and color in Macaque V1. Journal of Neurophysiology, 72, 2151-2166. ↵