
II. FROM OPTICAL TO VISUAL EFFECTS
14. PHOTONS VARY IN EFFECTIVENESS
–But It’s Not All Their Fault
The relationship between photon density and subjective brightness introduces our explanations of how our visual system transforms the information reaching our eyes into a visible image.
Applied to measuring subjective brightness in terms of physical energy, Fechner’s methods reveal that differences in photon density do not necessarily match differences in the resulting brightness. For over a 100 years, ever more sensitive measurements have found several other factors that determine how the visual system processes the retinal effects of photon density to produce “brightness”. Here are the major factors:
1.Brightness varies depending on the photons’ wavelength.- see the next page.
2. More precise sensitivity measurements reveal two systems of photoreceptors.
photopic receptors, called cones, operate in daylight conditions
scotopic receptors, called rods, operate at night and are 1000 X as sensitive
3. These two systems differ in sensitivity to photon wavelength – see the next page.
4. The sensitivity of both systems increases or decreases over time at different rates to compensate and adapt to changes in the light level – see Ch 16.
5. Different wavelengths result in color as well as brightness differences – see Ch 20
6. The number of receptors in each system varies greatly with location on the retina – see Ch 24. Therefore, brightness differs depending on where the observer looks to make the observations.
7. The brightness of a spot at one location can be altered by the brightness at nearby locations – Ch 17.
Various versions of Fechner’s Psychophysical Methods are used to control these factors.
We begin by considering how brightness varies with photon wavelength.
The Photopic System
The relative sensitivity of the photopic system to different wavelengths can be measured by adjusting the photon density, measured in terms of radiance of a “white” (3,000o K Blackbody radiation – page 4) light to match the brightness of wavelengths from 400 to 700 nm that have the same radiance.
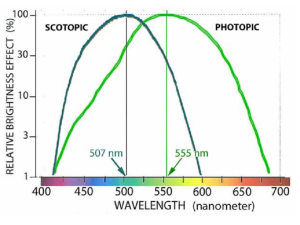 Photons at 555 nm require the most white light for a brightness match.
To match the brightness of 415 and 690 nm photons, the white radiance must be reduced to 1% of the 555 nm radiance.
Matching the other wavelengths scales the photopic system’s relative brightness response:
Based on measurements of this type, from several labs, the International Commission on Illumination (CIE) created a Photopic Standard to describe our wavelength (color) sensitivity in daylight conditions. (To learn more about the CIE standards and how light is measured, see Appendix D – Measuring Light.)
Multiplying a radiance measurement at a specific wavelength by its relative brightness value results in a new measurement, luminance that is proportional in brightness to luminance measurements at other wavelengths. (Equal radiance measurements of different wavelengths can differ greatly in brightness, as indicated by the above figure.) However, most applications of light, from colored signal lights to room lighting involve light containing many or all visible wavelengths. Rather than measuring, correcting, and summing wavelength by wavelength, a simpler approach is generally used. A filter whose light transmission matches these relative values across wavelength is placed in front of a radiometer. This converts its radiance measurement into a luminance in a single step.
The Scotopic System
A different approach is used to measure the sensitivity of the scotopic system. (Persons making these observations must be fully dark-adapted – see Ch 16.) For each wavelength, photon radiance is slowly reduced until its brightness just disappears. Then the radiance is further reduced and slowly increased until some brightness just appears. The average of such repeated measurements estimates the threshold. (It is assumed that the wavelengths are matched as equally “dim” at threshold.)
Photons at 507 nm have the lowest threshold density. This indicates the scotopic system is most sensitive at that wavelength. Plotting these measurements in terms of relative sensitivity enables comparing the two systems as shown above. These results provide the CIE scotopic standard for measuring visual sensitivity in nighttime conditions.
To simplify matters, the rest of our story will focus on photopic levels of light.