
Chapter 1: An Introduction to QGIS
Part IV: Adjusting a Layer’s Transparency
Sometimes, we do not want to fully delete a layer but rather adjust its transparency so that we can see “through” it to the layers lying below. We can adjust the transparency of vector and raster data, although the process is slightly different for each.
Adjusting the Transparency of Vector Data
Let’s return to the idea of the Island’s urban communities taking over what were once forested areas.
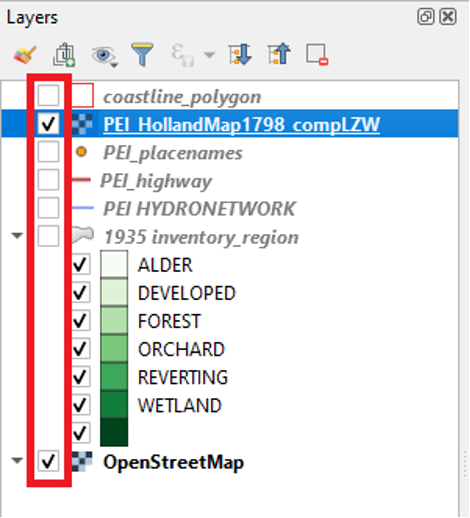
- Uncheck all layers in the table of contents other than the 1935 inventory region layer and the OpenStreetMap layer.
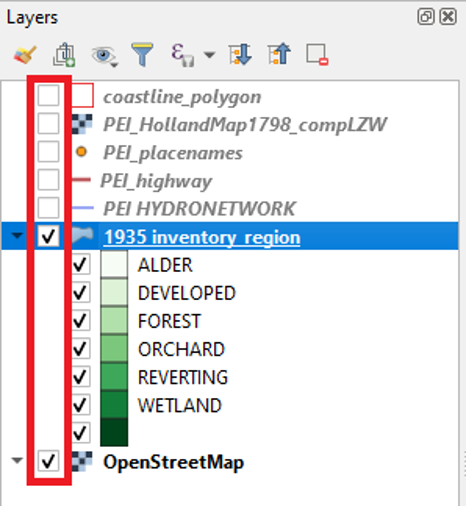
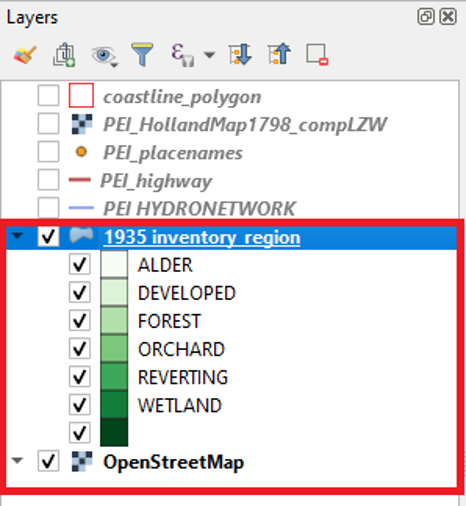
- Make sure the 1935 inventory region layer is above the OpenStreetMap layer in the table of contents.
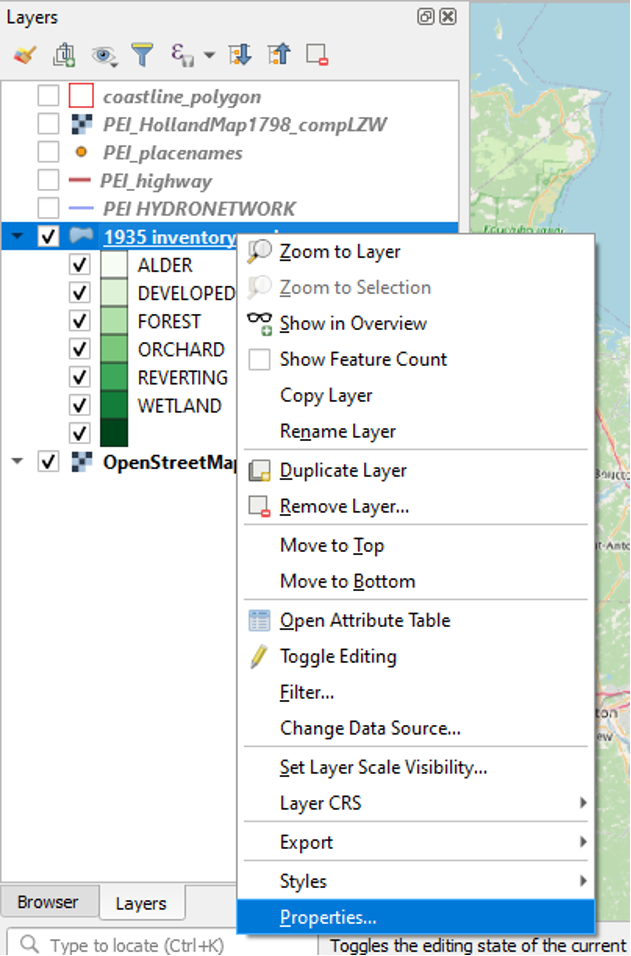
- Right-click the 1935 inventory region layer.
- Click Properties.
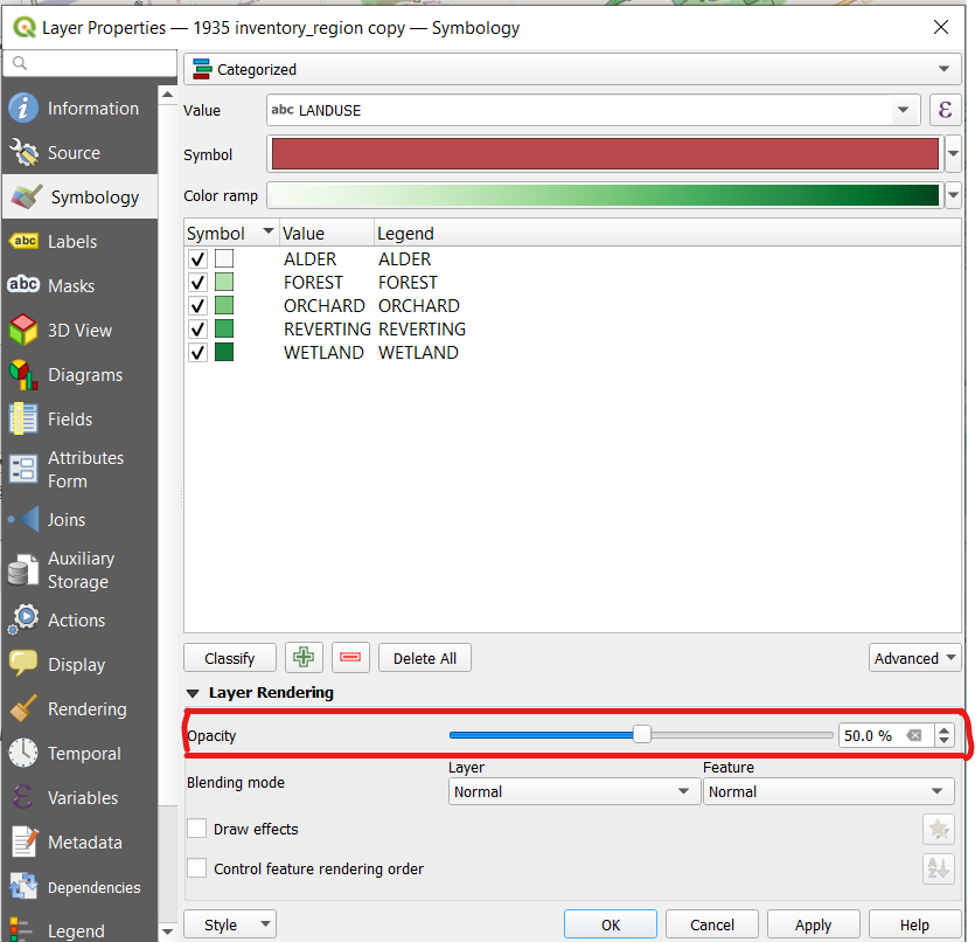
- Click Symbology.
- Click Layer Rendering
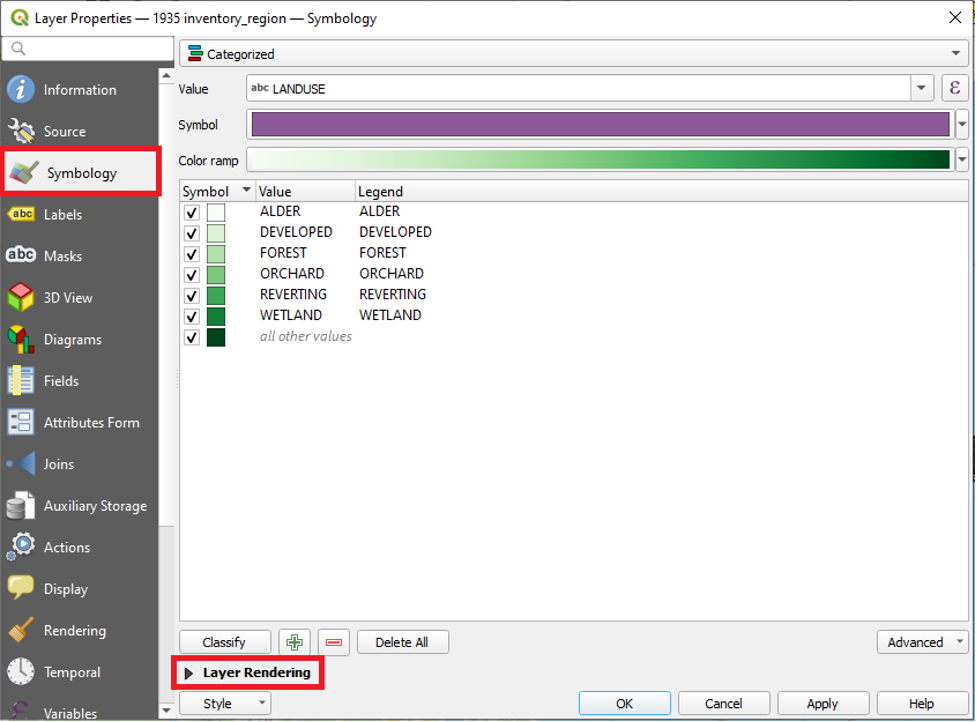
- Adjust the Opacity value to 50.0%. Ignore the other settings in the Layer Rendering menu.
- Click OK.
We can now zoom into any community on PEI and try to see any effects of deforestation.
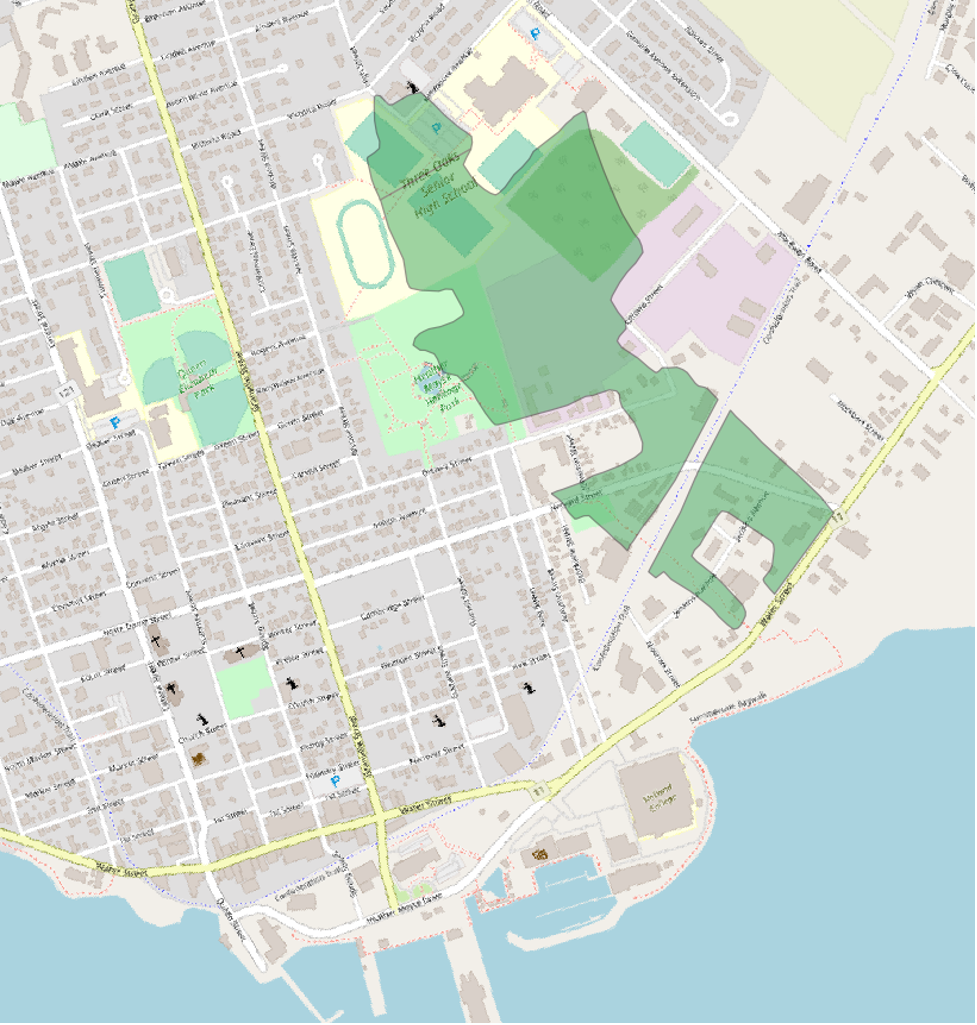
For example, if we look at the area in Summerside where Three Oaks Senior High School is, we can now see “through” the 1935 forestry map to see the OpenStreetMap beneath it. We can now simultaneously see the forest cover that once existed at that location as well as the modern-day, urban landscape that supplanted it.
Adjusting the Transparency of Raster Data
As you will recall, we added a raster layer to our project in Part III of this chapter. The raster is called “PEI_HollandMap1798.”
As we said at the end of Part III, Holland’s map is helpful for getting a grasp of how the heavily forested interior of the Island shaped settlement patterns. European newcomers settled and did most of their business around the Island’s coasts and waterways. Holland’s map shows soundings, which were measurements of the water depth in certain critical areas of sea traffic, such as the Hillsborough Bay. Since sea travel was so important to this coast-base settler society, Holland and his team included these soundings.
While Holland’s map shows only a few inland settlements, he and his team mapped many coastal settlements. They also went to great lengths to map many smaller islands around PEI.
Despite being focused on the Island’s coast, the Holland map inaccurately displays certain parts of it. In the last part of this chapter, we could see these errors by adding the coastline layer and laying it over the top of the Holland map layer.
In this section, we will use the transparency tool as another way to assess the map’s coastal inaccuracies. We will judge its accuracy in relation to the OpenStreetMap base map that lies beneath it.
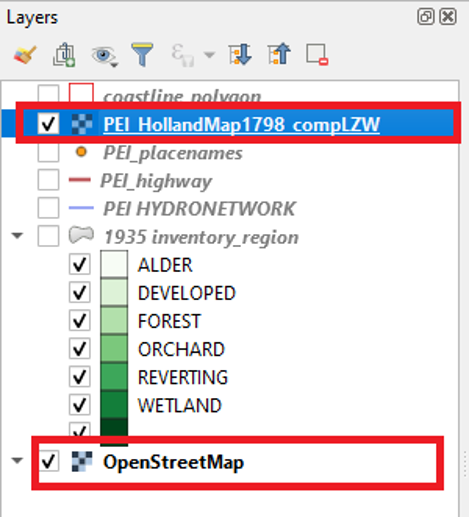
- Uncheck all layers in the table of contents other than the Holland map layer and the OpenStreetMap layer.
- Make sure the Holland map layer is placed above the OpenStreetMap layer in the table of contents.
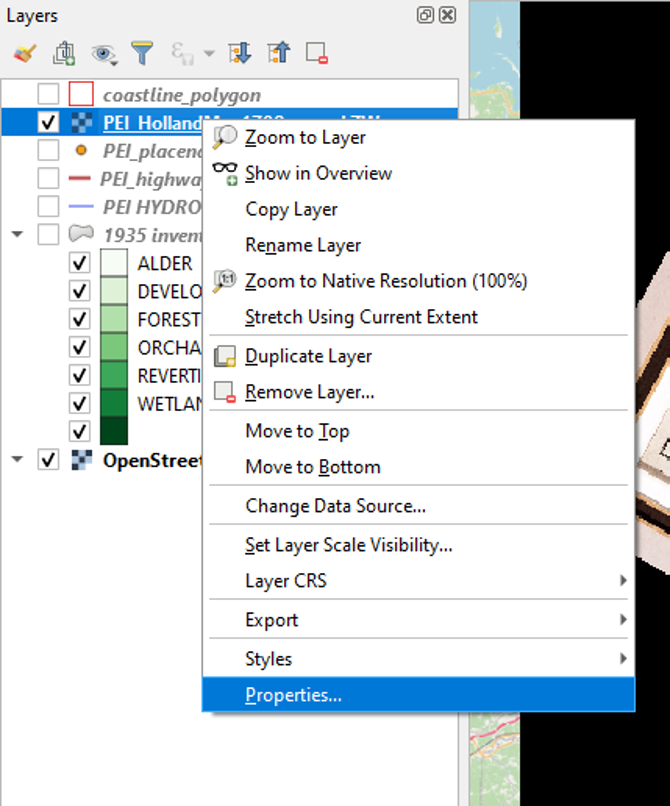
- Right-click the Holland map layer in the table of contents.
- Click Properties.
- Click Transparency
- Change the Global Opacity to 50.0%.
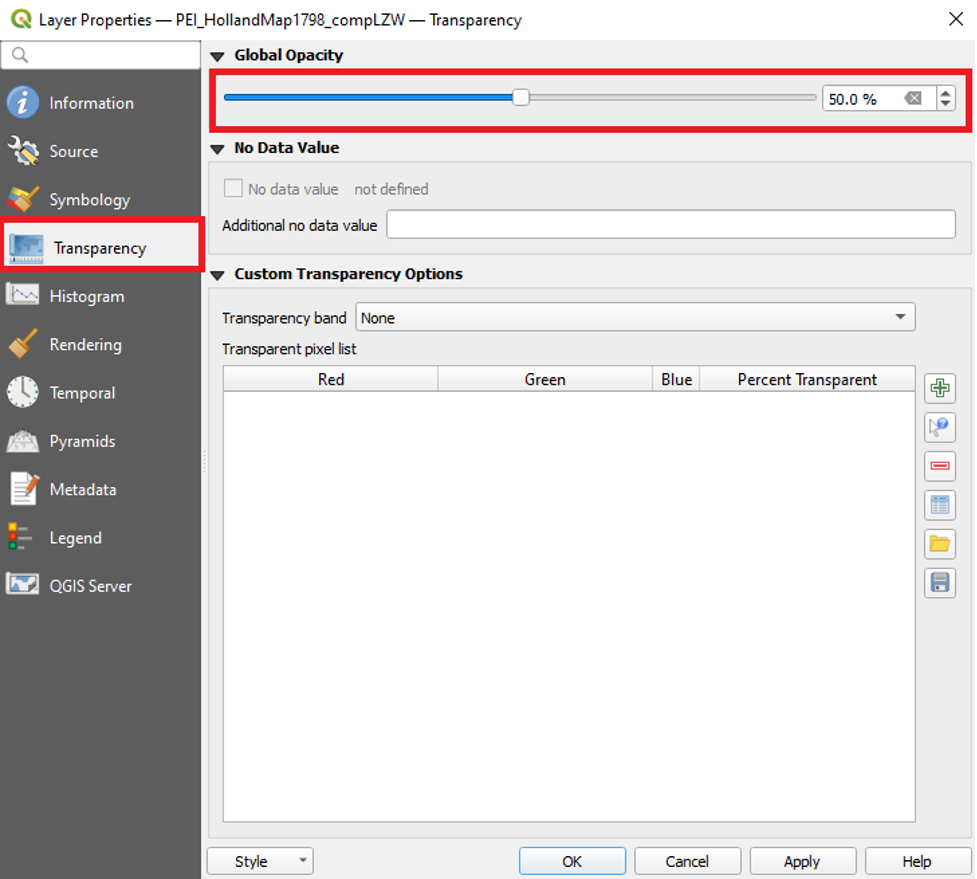
- Click OK.
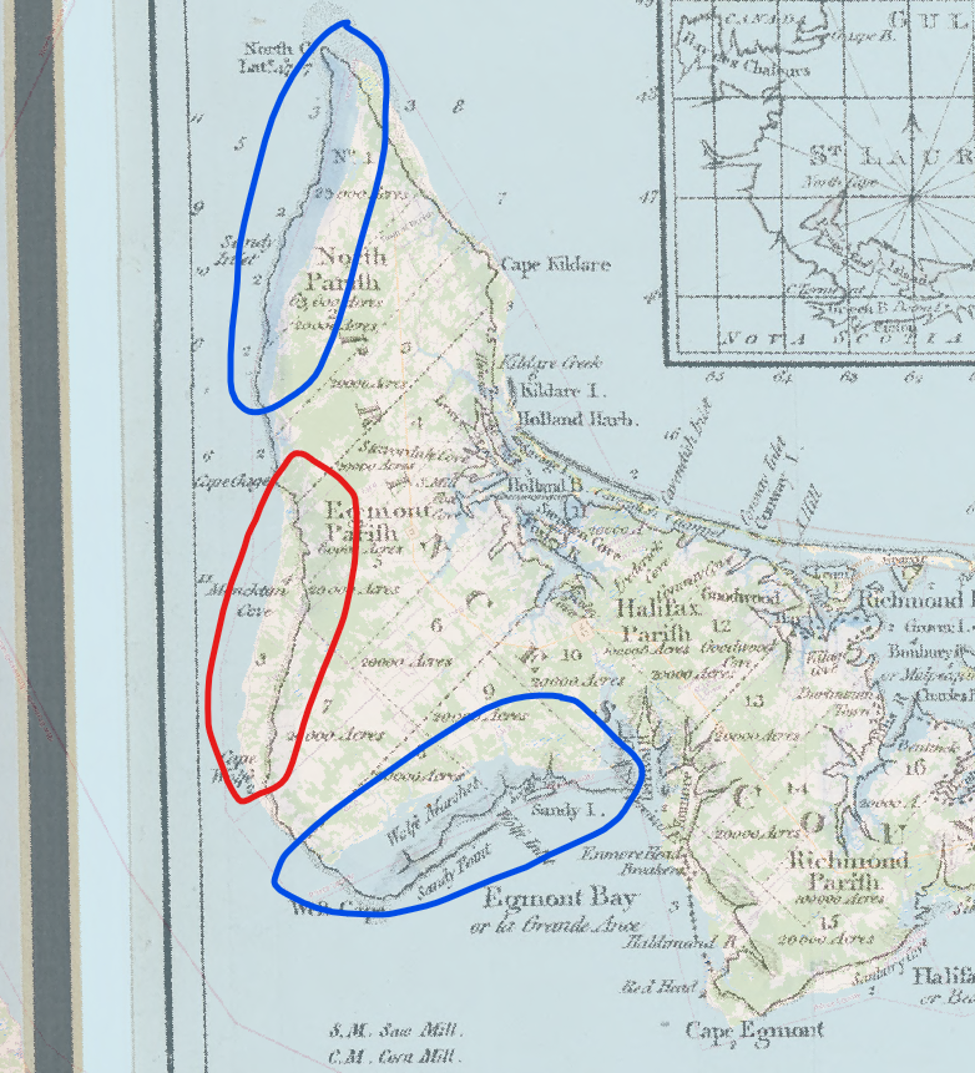
With the Holland map’s transparency at 50.0%, we can see the OpenStreetMap layer beneath it. Have a look at the western shore of the Island’s Prince County.
There are some areas, shown in blue in the screenshot, that Holland and his team mapped incorrectly. Holland mapped the island boundaries too far inland in some places along the western coast of Prince County (see the area circled in blue). On the other hand, Holland and his team mapped other areas of the Island as though they were in the sea. An example of such an area is shown in red in the screenshot.
Making a raster transparent can help us determine its accuracy. But making a raster transparent can also help us to verify our own accuracy when we are orienting that raster over the top of a base map. This process is known as georeferencing, and we will cover it in the next chapter.