
Chapter 3: Georeferencing in QGIS
Getting Started
Overview: What Is Georeferencing?
This chapter will teach you how to work with georeferenced maps in QGIS, and it will also teach you how to georeference your own digital copies of historical maps in QGIS.
Georeferencing is a digital mapping process that involves importing a digital copy of a map (usually acquired by scanning a physical map) into the GIS software. That map is then pinned to its correct location on the globe in our GIS. This allows us to use the historical map as a basemap or other layer in reference maps, or we can extract historical information from the digitized map as new vector layers. We may then analyze and symbolize the features in those new layers, or we may simply compare them visually with information from other sources. Historians sometimes use georeferencing to digitize a single feature from a historical map and discard the other features that are not relevant for their research. We may then overlay select features from multiple maps and avoid all of the “noise” that would result from having those maps overlaid in a series of semi-transparent images.
Once a map has been georeferenced, it can be saved as a raster. Raster data is one type of data in GIS. It is a digital image of a map that we have assigned with real-world geographic coordinates through the process of georeferencing.
By saving a map as a raster, we permanently embedding those coordinates to that digital image. So, if you were to open the raster in another GIS project or program, the image would appear in its proper location on the globe in that GIS. In brief, when we georeference, we are anchoring an otherwise positionless digital image to a specific location on our GIS’ globe. Once we have georeferenced a map in our GIS, we can analyze and display it in a variety of ways.
Two Streams
This chapter is divided into Stream A and Stream B. You can choose to complete either or both parts. In Stream A, we will download a digital image of a historical map of eastern Prince Edward Island from 1991. This digital map has already been georeferenced and anchored to its correct location in a GIS. So, when we import it into our GIS, it will automatically appear in its proper location on our GIS’s globe.
In Stream B, we will then teach you how to georeference a different map of the same area. We will use a scanned image of an 1880 map of Georgetown, PEI. We will assign accurate coordinates to the 1880 map by digitally aligning its geographic features with those of our GIS’ globe. Once this georeferencing process is complete, we will be able to analyze the resulting raster.
Any data that we can gain from this raster of Georgetown, such as the number of houses in town in 1880, would be considered vector data. Because vector data is based on georeferenced rasters, users must, as we will in this lesson, turn a digital image of a map into a raster before they may create any vector data from it. We will show you how to create vector data from both the 1991 map and your newly georeferenced 1880 map in Chapter 4: Digitization.
Example Exercises: Two Historical Maps of PEI’s Georgetown,
“The Town That Time Forgot”
The focus of this chapter is on eastern PEI, in general, and on Georgetown, in particular. Those users who choose to complete both Stream A and B will have the added bonus of getting to analyze this interesting town at two time points: 1880 and 1991.
If you will recall, Samuel Holland was the eighteenth-century British surveyor whom we met in earlier chapters. When he created his map of Prince Edward Island in 1765, he divided the Island into 67 lots. Each lot was about 20,000 acres in size. He then separated these lots into three counties of about 500,000 acres each: Kings County, Queens County, and Prince County. We saw a version of his map of PEI at the end of Chapter 1.
Holland planned one town in each county that he thought would serve as the capital of that county. These capital towns were in areas that Holland thought would be ideal locations for settlement and commerce. He named the counties after the British Royal Family, and he named each county’s capital town after a member of the Royal Family. The British king at the time was George III, so Holland named the capital town of Kings County Georgetown. George III’s son and heir, the Prince of Wales, was also named George. So, to avoid confusion, Holland gave Prince County’s capital city the comparatively generic name of Princetown. Holland honoured George III’s wife, Queen Charlotte, by naming Queens County’s capital town Charlottetown.
As it turns out, Charlottetown has become the greatest success of the three towns that Holland planned. Now the Island’s provincial capital, Charlottetown has an excellent natural harbour. It also lies at the mouths of the North and Hillsborough Rivers, which penetrate deep into the Island’s heart. As we saw in the previous chapter, rivers such as these were critical transportation routes during the settlement era, a time when PEI was heavily forested and nearly impenetrable by land. In this chapter, we will focus on Georgetown’s rise and fall as a capital town.
During the nineteenth century, it appeared that Georgetown had achieved much of the potential that Holland saw in it. Holland recognized that Georgetown’s principal asset was its harbour. It has always been PEI’s best natural harbour, and perhaps one of the best in North America. This is partly because two islands that lay off of Georgetown’s coast, Panmure Island and Boughton Island, form a sort of breakwater that prevents silt from forming in the Georgetown harbour.[1] We will explore these islands, as well as others off of Georgetown’s coast, including Poxy Island, Brudenell Island, and Grave Island, in Part II of the textbook. Like Georgetown, these are places that time has forgotten.
During the nineteenth century, Georgetown prospered as a hub of shipbuilding and commerce. A ferry operated across the Northumberland Strait between Georgetown and Pictou, Nova Scotia. Georgetown was an important gateway between PEI and the mainland. This status was augmented in 1872, when the PEI Railway arrived in Georgetown. Even more passengers and goods now came by rail to Georgetown, where they then got onto the ferry.[2]
However, the twentieth century was not very kind to Georgetown. By this time, the PEI Railway had redirected much of the Island’s commerce towards inland areas and overland means of transportation, so Georgetown’s excellent harbour became less important. Moreover, in the early-twentieth century, a ferry link between PEI’s Borden-Carleton and New Brunswick’s Cape Tormentine replaced Georgetown’s ferry link with Pictou. The decline in Georgetown’s shipbuilding industry siphoned even more life out of the town. As a result of these twentieth-century developments, Georgetown lost “most of its mercantile and professional class of people.” Its overall population declined from around 1200 in the nineteenth century to about 750 by the 1970s.[3]
Today, Georgetown remains a “ghost town.”[4] At the end of a dead-end road and out of the reach of the Island’s circulation of traffic and commerce, Georgetown has seemingly continued to wither since the 1970s. Georgetown is perhaps PEI’s version of Staten Island. The glamour of Manhattan and Brooklyn, New York, outshine the geographically isolated Staten Island. In PEI, Georgetown became economically isolated from the prosperity of the Three Rivers Municipality (centered on the nearby town of Montague) and the larger province.
After we have georeferenced the maps from Stream A and B, we will be able to search them for clues as to Georgetown’s unfortunate and unforeseen decline. Why did Holland’s hopes for Georgetown not pan out?
This study of the georeferenced maps of Georgetown will illustrate the advantages that georeferenced maps offer to urban history and related disciplines. Georeferenced maps such as these can help researchers understand recent changes at the regional or county scale or the changes that occurred in two or three blocks of an urban area.
Saving Your Project
In your computer’s Documents folder, there will be a folder named “QGIS” that was put there in Chapter 1.
- Within the QGIS folder, create a new folder called Chapter3.
Stream A
If you plan only to complete Stream A, you can save your new project in the Chapter3 folder.
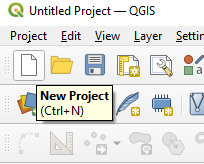
- Open QGIS and click “new project”
- Click the disc icon or hit Ctrl+S to save the project. Save your project in the Chapter3 folder. Name your project Project3.qgz.
Stream B
If you plan to complete this entire chapter, create the following folder structure.
- Within the Chapter3 folder, create subfolders called:
- ControlPoints
- ProjectFiles
- Rasters
- Rectified
- ReferenceData
- Open QGIS and click “new project”
- Click the disc icon or hit Ctrl+S to save the project. Save your project in this ProjectFiles folder. Name your project Project3.qgz.
[1] Edward MacDonald, “The French Regime” (Lecture, History 3310, University of Prince Edward Island, September 16, 2020).
[2] Robert C. Tuck, “Georgetown: The Town That Time Forgot,” The Island Magazine (1978): 24, 27-28. http://vre2.upei.ca/islandmagazine/fedora/repository/vre%3Aislemag-batch2-56/OBJ.
[3] Tuck, 24, 27-28.
[4] Tuck, 22.