
Chapter 1: An Introduction to QGIS
Part III B: Opening Rasters
Now that we have learned about vector data, we can turn our attention to raster data. A raster is a digital image of a map that has accurate coordinates added to it through the process of georeferencing. This textbook will teach you how to georeference in Chapter 3: Georeferencing. For now, we will use a raster that has already been georeferenced.
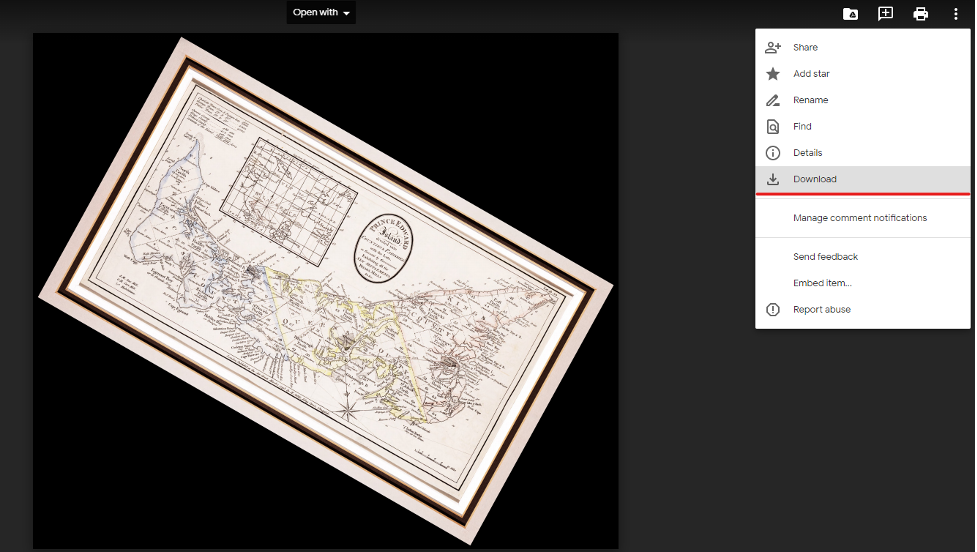
The raster we will add is a reproduction of the map that British naval captain Samuel Holland produced in the 1760s. Holland produced this map to provide the British, who had just acquired the Island, with a better understanding of PEI (or, as it was known at the time, St. John’s Island). Holland surveyed the Island and divided the Island into 67 lots, which were then given out to British owners in the Great Lottery of 1767. This reproduction of Holland’s original map was produced in 1798.
Maps like this one show how, at the time, the Island’s forests were so dense that they heavily influenced settlement patterns. Settlers could not easily penetrate the forests, so most of the villages on the map are along the coasts or along the navigable rivers.
After we add the 1798 map, we can compare the settlement locations at that time with the ones from the modern OpenStreetMap basemap. We will be able to see how deforestation—along with other factors, such as the construction of Prince Edward Island Railway in the 1870s—allowed Islanders to settle throughout the Island’s interior. We can see towns in the Island’s interior today, such as Kensington and Hunter River. These towns did not exist in the early settlement period, partly because the dense forest made it difficult to traverse the Island’s interior.
Adding a Raster
Let’s add the 1798 map to our project.
Click here to download the 1798 map to your Data folder.
We will use this file as the first raster layer we add to our project.
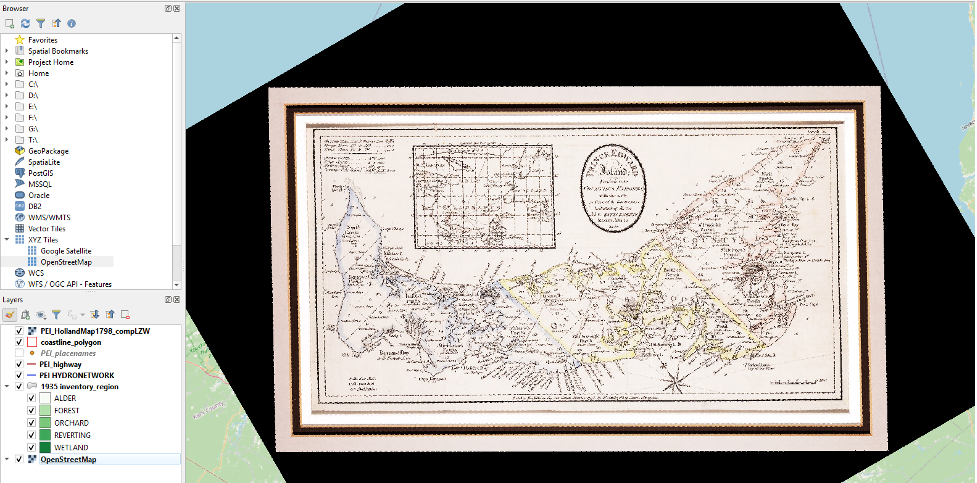
● Use the Browser to add the 1798 map raster to QGIS in the same way that you added vector layers.
Symbolizing the Coastline File over the Top of a Raster
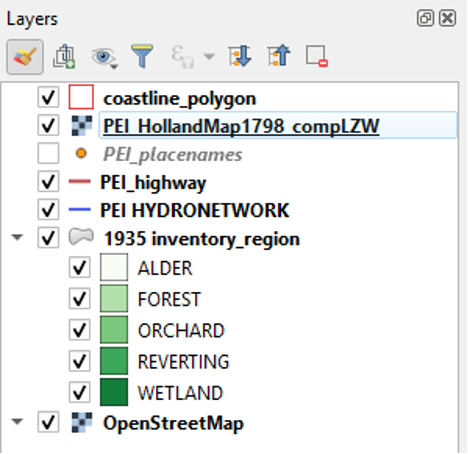
To get a sense of the coastline on which most Islanders settled before the Island’s interior was deforested, we can move the coastline layer above the PEI_HollandMap1798_compLZW.
- Drag the coastline layer above the PEI_HollandMap layer.
Now we will make the coastline overlay have a more pronounced appearance.
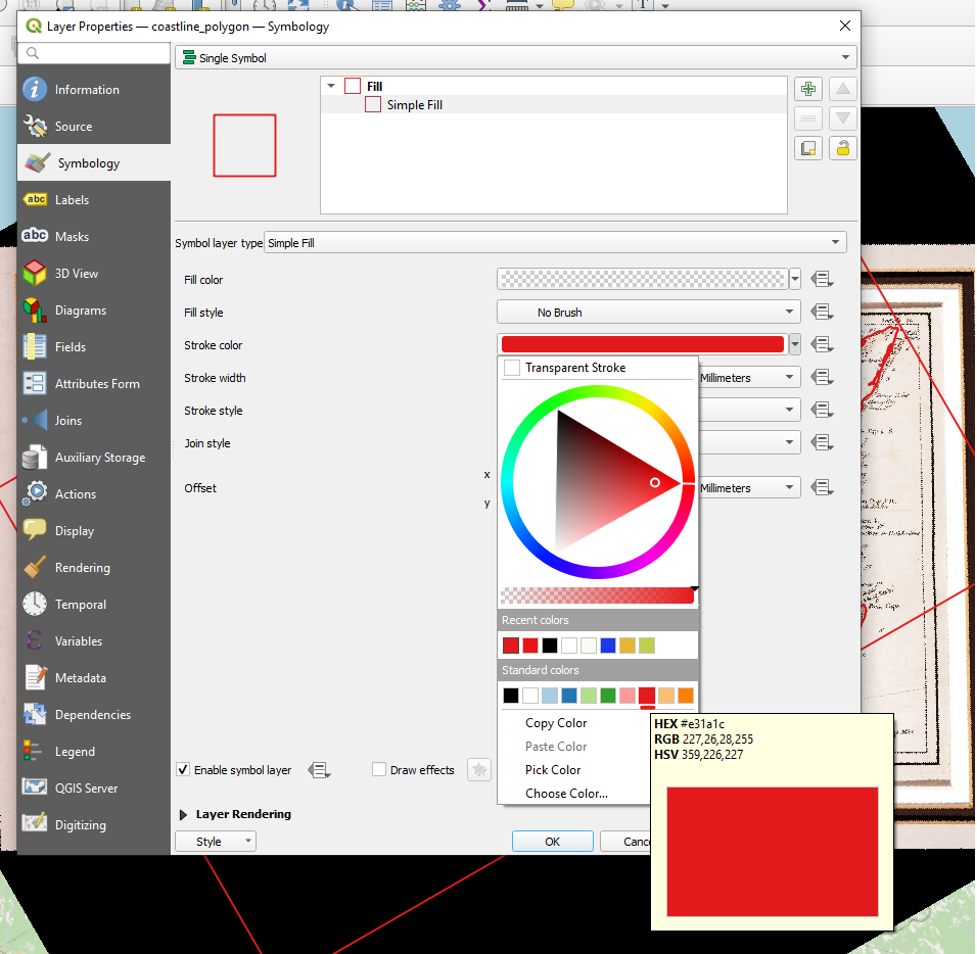
- Open the coastline_polygon layer’s Properties, click Symbology, and select Simple Fill.
- Click the dropdown arrow next to Fill Color and select Transparent Fill.
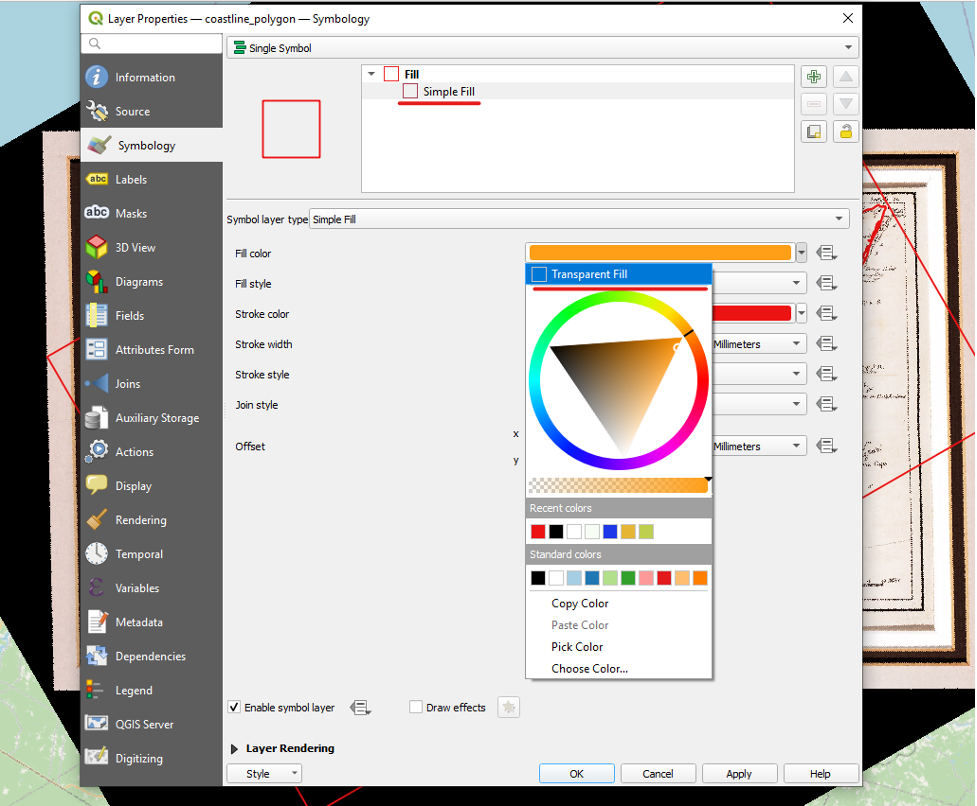
- Click the dropdown arrow next to Stroke Color and, under Standard Colors, select red.
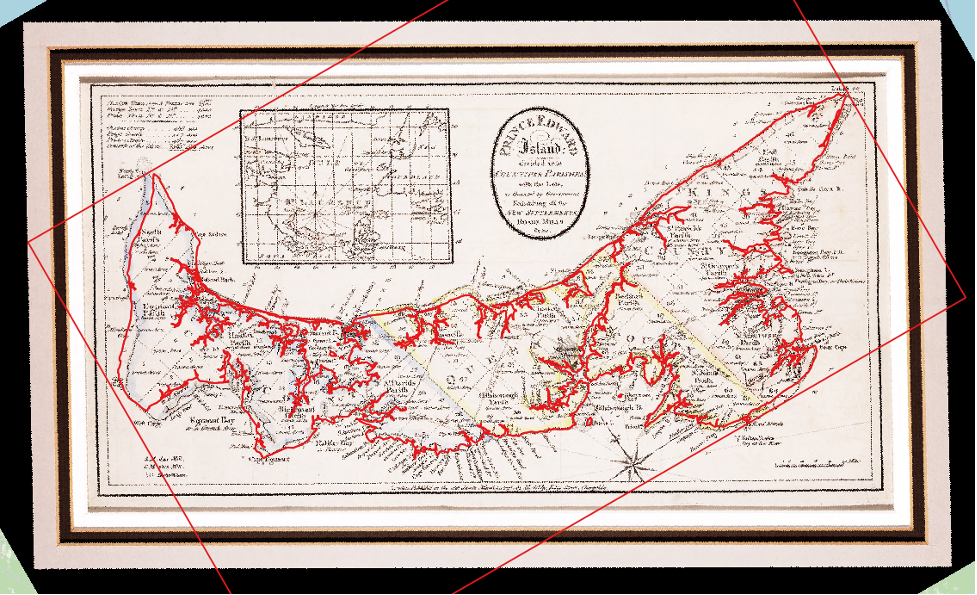
We are now able to see clearly the shape of the coastlines, which were the areas of settlement and commercial activity on the Island before deforestation allowed greater access into its interior.
Making the coastlines from today’s map visible over the top of the 1798 map is also useful for assessing the older map’s accuracy. While Captain Holland and his team produced a remarkably accurate map of PEI at the time, we can see that it has flaws. For example, there are inaccuracies along the coast of Egmont Bay.
Another way that we can assess the accuracy of Holland’s map is by adjusting its transparency. We will return to this concept at the end of the next part of the chapter.