
Main Body
14 14/ Accounting
Fundamentals of Business: Canadian Edition by Pamplin College of Business and Virginia Tech Libraries is licensed under a Creative Commons Attribution-NonCommercial-ShareAlike 4.0 International License, except where otherwise noted.

SOURCE: Ketut Subiyanto .
Accounting and Financial Information
Learning Objectives
Explain the differences between managerial accounting and financial accounting.
Identify users of accounting information and explain how they use it.
Explain the function of the income statement.
Calculate revenue, expenses, and net profit.
Explain the function of the balance sheet.
Calculate assets, liabilities, and shareholders’ equity.
Explain the function of the cash flow statement.
Calculate a break-even point given the information.
Evaluate a company’s performance using financial statements and ratio analysis.
Show What You Know
 An interactive or media element has been excluded from this version of the text. You can view it online here: Link.
Most Valuable Player

SOURCE: Pixabay.
Apple Inc. is one of the most valuable companies in the world. This statement is based on market value, which in April 2018 was roughly $841 billion. Although markets can fluctuate, sometimes wildly, if you are reading this chapter for a course later in 2018 or in 2019, it is not unlikely that Apple will have kept its leadership position. Its value as of April 2018 was more than $80 billion greater than that of the next largest company, Amazon. Apple has briefly ceded the leadership position to Alphabet, the parent company of Google, on a couple of occasions, but mostly, it has been the leader.208
You may wonder what kind of information is used to make these determinations. How does the market know that Apple should be valued more than $120 billion higher than Alphabet?209 Do investors just make their decisions on instinct? Well, some do, but it is not a formula for sustained success. In most cases, in deciding how much to pay for a company, investors rely on published accounting and financial information released by publicly traded companies. This chapter will introduce you to the subject of accounting and financial information so you can understand how the valuation process works.
The Role of Accounting
Accounting is often called “the language of business” because it communicates so much of the information that owners, managers, and investors need to evaluate a company’s financial performance. These people are stakeholders in the business, they are interested in its activities because they are affected by them. The financial futures of owners and other investors may depend heavily on strong financial performance from the business, and when performance is poor, managers may be replaced or laid off in a downsizing. In fact, a key purpose of accounting is to help stakeholders make better business decisions by providing them with financial information. You should not try to run an organization or make investment decisions without accurate and timely financial information, and it is the accountant who prepares this information. Accountants make sure that stakeholders understand the meaning of financial information, and they work with both individuals and organizations to help them use financial information to deal with business problems.
Collecting all the numbers is the simple part. The hard part is analyzing, interpreting, and communicating the information. Of course, you also must present everything clearly while effectively interacting with people from every business discipline. We are now ready to define accounting as measuring and summarizing business activities, interpreting financial information, and communicating the results to management and other decision makers.
Fields of Accounting
Accountants typically work in one of two major fields. Management accountants provide information and analysis to decision makers inside the organization to help them run it. Financial accountants furnish information to individuals and groups both inside and outside the organization to help them assess its financial performance. Their primary focus, however, is on external parties. Management accounting helps you keep your business running while financial accounting tells the outside world how well you are running it.
Management Accounting
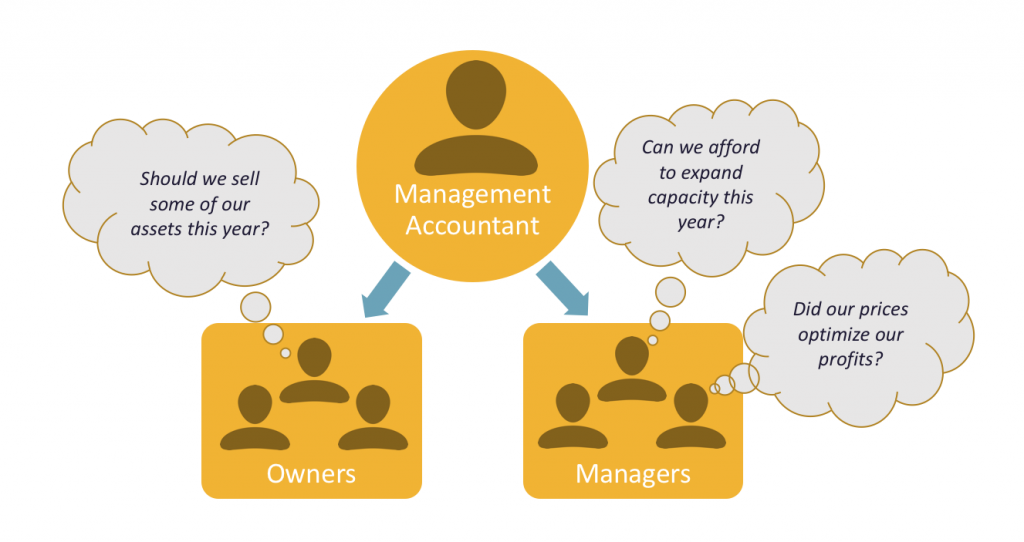
Management accounting, also known as managerial accounting, plays a key role in helping managers carry out their responsibilities. Because the information that it provides is intended for use by people who perform a wide variety of jobs, the format for reporting information is flexible. Reports are tailored to the needs of individual managers, and the purpose of such reports is to supply relevant, accurate, timely information that will aid managers in decide. In preparing, analyzing, and communicating such information, accountants work with individuals from all the functional areas of the organization (human resources, operations, marketing, etc.).
Figure 1. Role of Managerial Accounting
Financial Accounting
Financial accounting prepares the organization’s financial statements (income statement “profit/loss statement,” statement of owner’s equity, balance sheet, and statement of cash flows) that summarize a company’s past performance and evaluate its current financial condition. If a company is traded publicly on a stock market such as the TSX (Toronto Stock Exchange), these financial statements must be made public, unlike the internal reports produced by management accountants.
In preparing financial statements, Canadian financial accountants adhere to a uniform set of rules called international financial reporting standards (IFRS), the basic principles for financial reporting issued by an independent agency called the Financial Accounting Standards Board (FASB). Users want to be sure that financial statements have been prepared according to IFRS because they want to be sure that the information reported in them is accurate. They also know that when financial statements have been prepared by the same rules, they can be compared from one company to another.
Who Uses Financial Accounting Information?
The users of managerial accounting information are easy to identify (basically, they are a firm’s managers). We need to look a little more closely, however, at the users of financial accounting information, and we also need to know a little more about what they do with the information that accountants provide them. Publicly Traded companies will provide their financial accounting information to a wider set of stakeholders, including shareholders, potential investors, etc., than compared to a privately held company that will generate a single set of financial statements according to the International Financial Reporting Standards. Publicly Traded companies will also provide their financial accounting information to the public to showcase to potential investors the company’s performance. Therefore, Publicly Traded companies will typically generate two sets of financial statements, one set of detailed statements under Canadian International Financial Reporting Standards (IFRS) and another set of simplified financial statements that can be more easily consumed by the public. For example, Tim Hortons provides access to their simplified financial statements through annual reports which can be found at http://www.rbi.com/Annual-Reports
Owners and Managers
In summarizing the outcomes of a company’s financial activities over a specified period, financial statements are report cards for owners and managers. They show, for example, whether the company did (or did not) make a profit and furnish other information about the firm’s financial condition. They also provide some information that managers and owners can use to take corrective action, though reports produced by management accountants offer a much greater level of depth.
Investors and Creditors

SOURCE: Pete Souza. Warren Buffett, Presidential Medal of Freedom recipient in 2011.
Investors and creditors furnish the money that a company needs to operate, and they want to know how that business is performing. Because they know it is impossible to make smart investment and loan decisions without accurate reports on an organization’s financial health, they study financial statements to assess a company’s performance and to decide about continued investment.
According to the world’s most successful investor, Warren Buffett, the best way to prepare yourself to be an investor is to learn all the accounting you can. Buffett, chairman and CEO of Berkshire Hathaway, a company that invests in other companies, turned an original investment of $10,000 into a net worth of $66 billion210 in four decades, and he did it by paying close attention to financial accounting reports.
Government Agencies
Businesses are required to furnish financial information to several government agencies. Publicly owned companies (the ones whose shares are traded on a stock exchange) must provide annual financial reports to their respective provincial Securities Commission. For example, companies in Ontario would provide financial reports to the Ontario Securities Commission (OSC), a federal agency that regulates stock trades and which is charged with ensuring that companies tell the truth regarding their financial positions. Companies must also provide financial information to the Canadian Revenue Agency (CRA).
Figure 2. The Role of Financial Accounting
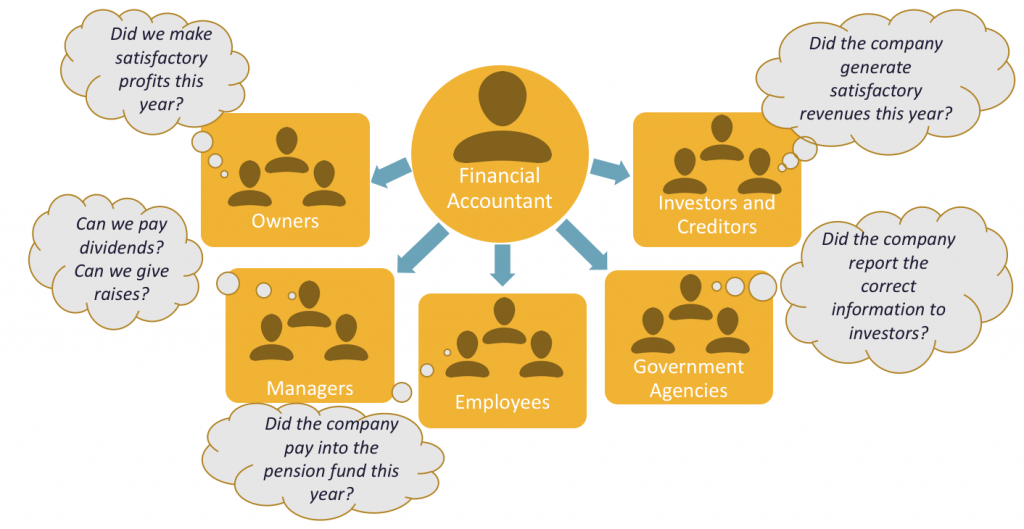
Other Users
Several other external users have an interest in a company’s financial statements. Suppliers, for example, need to know if the company to which they sell their goods is having trouble paying its bills or may even be at risk of going under. Employees and labour unions are interested because salaries and other forms of compensation depend on an employer’s performance.
The previous figures illustrate the main users of management and financial accounting and the information produced by accountants in the two areas. In the rest of this chapter, we will learn how to prepare a set of financial statements and how to interpret them. We will also discuss issues of ethics in the accounting communities and career opportunities in the accounting profession.
Understanding Financial Statements
We hope that, so far, at least one thing is clear: If you are in business, you need to understand financial statements. The law no longer allows high-ranking executives to plead ignorance or fall back on delegation of authority for responsibility of a firm’s financial reporting. In a business environment tainted by episodes of fraudulent financial reporting and other corporate misdeeds, top managers are now being held responsible for the financial statements issued by the people who report to them. Top managers need to know how well the company is performing. Financial information helps managers identify signs of impending trouble before it is too late.
The Function of Financial Statements
Put yourself in the place of Lee, who runs Lee’s Confections out of their home. They loves what they do, and feels that they are doing pretty well. In fact, Lee has an opportunity to take over a nearby store at very reasonable rent, needing to get a modest bank loan and investing more of their money. It is decision time: they know that the survival rate for startups is not good, and before taking the next step, they would like to get a better idea of whether it is worth the risk. The basic financial statements will give them some answers. Here, three common statement types are introduced.
Income Statement = Show’s sales, expenses, and whether a profit was made.
Balance Sheet = Show assets and liabilities, the amount invested in the business.
Statement of Cash Flows = Show how much cash is coming in and going out.
Even from this basic overview, match which financial statement answers each of Lee’s questions.
 An interactive or media element has been excluded from this version of the text. You can view it online here: Link.
Since this book is for an introductory course, attention is on the income statement, balance sheet, and cash flow statement only, even though other financial statements are mentioned.
Toying with a Business Idea
To bring this concept closer to home, let us assume you need to earn money while you are in college and that you have started a small business. Your business will involve selling stuff to other college students, we assume that you are going to operate on a “cash” basis: you will use cash for everything, and everyone who buys something from you will pay in cash.
You may have a little cash on you right now (some currency, or paper money, and coins). In accounting, however, the term cash refers to more than just paper money and coins. It also refers to the money that you have in chequing and savings accounts and includes items you can deposit in these accounts, such as money orders and different cheques.
Your first task is to decide exactly what you are going to sell. You have noticed that with homework, exams, social commitments, and the hectic lifestyle of the average college student, you, and most of the people you know always seem to be under a lot of stress. Sometimes you wish you could just lie back between meals and bounce a ball off the wall, and that is when the idea hits you: Maybe you could make some money by selling a product called the “Stress-Buster Play Pack.” Here is what you have in mind: you will buy small toys and other fun stuff (instant stress relievers) at a local dollar store and pack them in a rainbow-coloured plastic treasure chest labelled “Stress-Buster.”
Here is where you stand: You have enough cash to buy a month’s worth of plastic treasure chests and toys. After that, you’ll use the cash generated from sales of Stress-Buster Play Packs to replenish your supply. Each plastic chest will cost $1.00, and you will fill each one with a variety of five simple toys, all of which you can buy for $1.00 each.
You plan to sell each Stress-Buster Play Pack for $10 from a rented table stationed outside a major dining hall. Renting the table will cost you $20 a month. To make sure you can complete your schoolwork; you decide to hire fellow students to staff the table at peak traffic periods. They will be on duty from noon until 2:00 p.m. each weekday except Fridays, and you will pay them a generous $7.50 an hour. Wages, therefore, will cost you $240 a month (2 hours × 4 days × 4 weeks = 32 hours × $7.50). Finally, you will run ads in the college newspaper at a monthly cost of $40. Your total monthly costs will amount to $300 ($20 + $240 + $40).
The Income Statement
Let us say that during your first month, you sell 100 play packs. Not bad, you say to yourself, but did I make a profit? To find out, you prepare an income statement showing revenues, or sales, and expenses, the costs of doing business. You divide your expenses into two categories:
Cost of goods sold: the total cost of the goods that you have sold.
Operating expenses: the costs of operating your business except for the costs of things that you have sold.
Now you need to do some subtracting:
The difference between sales and cost of goods sold is your gross profit, also known as gross margin.
The difference between gross profit and operating expenses is your net income or profit, which is the proverbial “bottom line.” Note we have assumed you are making money, but businesses can also have a net loss.
Below is your income statement for the first month (in cash).
Table 3. Stress-Buster Company Income Statement
|
Month Ended April 30, 2018 |
||
|
Sales (100 x $10.00) |
|
$1,000 |
|
Less cost of goods sold (100 x $6) |
|
$600 |
|
Gross profit (100x ($10 – $6)) |
|
$400 |
|
Less operating expenses |
|
|
|
Salaries |
$240 |
|
|
Advertising |
$40 |
|
|
Table rental |
$20 |
|
|
|
$300 |
|
|
Net income (Profit) ($400-$300) |
|
$100 |
Did You Make Any Money?
What does your income statement tell you? It has provided you with four pieces of valuable information:
You sold 100 units at $10 each, bringing in revenues or sales of $1,000.
Each unit that you sold cost you $6 – $1 for the treasure chest plus 5 toys costing $1 each. Your cost of goods sold is $600 (100 units × $6 per unit).
Your gross profit (the amount left after subtracting cost of goods sold from sales) is $400 (100 units × $4 each).
After subtracting operating expenses of $300 (the costs of doing business other than the cost of products sold) you have a positive net income or profit of $100.
The Balance Sheet
A balance sheet reports the following information:
Assets: the resources from which it expects to gain some future benefit
Liabilities: the debts that it owes to outside individuals or organizations
Owner’s equity: the investment in the business
Your income statement tells you how much income you earned over some period, your balance sheet tells you what you have at a specific point in time.
Companies prepare financial statements on at least a 12-month basis, for a fiscal year which ends on December 31 or some other logical date, such as June 30 or September 30. Fiscal years can vary because companies generally pick a fiscal year-end date that coincides with the end of a peak selling period; thus, a crabmeat processor might end its fiscal year in October, when the crab supply has dwindled. Most companies also produce financial statements on a quarterly or monthly basis. For Stress-Buster, you’ll want to prepare them monthly to stay on top of how your new business is doing. Let us prepare a balance sheet at the start and end of your first month in business.
The Accounting Equation
To prepare a balance sheet, one must first understand the fundamental accounting equation:
Assets = Liabilities + Owner’s Equity
This simple but important equation highlights the fact that a company’s assets came from somewhere: either from investments made by the owners (owner’s equity) or from loans (liabilities). This means that the asset section of the balance sheet on the one hand and the liability and owner’s-equity section on the other must be equal, or balance (balance sheet).
Let us prepare the two balance sheets we mentioned: one for the first day you started and one for the end of your first month of business. We’ll assume that when you started Stress-Buster, you borrowed $400 from your parents and put in $200 of your own money. If you look at your first balance sheet below, you see that your business has $600 in cash (your assets): Of this total, you borrowed $400 (your liabilities) and invested $200 of your own money (your owner’s equity). So far, so good: your assets section balances with your liabilities and owner’s equity section:
Table 4. Stress-Buster Company Balance Sheet
|
As of April 1, 2018 |
|
|
Assets |
|
|
Cash |
$600 |
|
Liabilities and Owner’s Equity |
|
|
Liabilities |
$400 |
|
Owner’s Equity |
$200 |
|
Total Liabilities and Owner’s Equity |
$600 |
Now let us see how things have changed by the end of the month. Recall that Stress- Buster earned $100 during the month of September and that you left these earnings in the business. This $100 profit increases two items on your balance sheet: the assets of the company (its cash) and your investment in it (its owner’s equity). Below shows what your balance sheet will look like on April 30. You now have $700 in cash: $400 that you borrowed plus $300 that you have invested in the business (your original $200 investment plus the $100 profit from the first month of operations, which you’ve kept in the business).
Table 5. Stress-Buster Company Balance Sheet
|
As of April 30, 2018 |
|
|
Assets |
|
|
Cash (original $600 plus $100 earned) |
$700 |
|
Liabilities and Owner’s Equity |
|
|
Liabilities |
$400 |
|
Owner’s Equity ($200 invested by owner plus $100 profits kept) |
$300 |
|
Total Liabilities and Owner’s Equity |
$700 |
Break-even Analysis
Let us take a brief detour to see how this information might be put to use. As you look at your first financial statements, you might ask yourself: is there some way to figure out the level of sales you need to avoid losing money, to “break-even”? This can be done using break-even analysis. To break-even (have no profit or loss), your total sales revenue must exactly equal all your expenses (both variable and fixed). Variable costs depend on the quantity produced and sold; for example, each Stress-Buster includes the treasure chest and the toys inside. Fixed costs don’t change as the quantity sold changes; for example, you’ll pay for your advertising whether you sell Stress-Busters. The balance between revenue and expenses will occur when gross profit equals all other (fixed) costs. To determine the level of sales at which this will occur, you need to do the following (using data from the previous example):
Determine your total fixed costs: Fixed costs = $240 salaries + $40 advertising + $20 table = $300
Identify your variable costs on a per unit basis: Variable cost per unit = $6 ($1 for the treasure chest and $5 for the toys)
Determine your contribution margin per unit: Selling price per unit – variable cost per unit: Contribution margin = $10 selling price – $6 variable cost per unit = $4
Calculate your break-even point in units: fixed costs: Contribution margin per unit: Break–even in units = $300 fixed costs ÷ $4 contribution margin per unit = 75 units
Your calculation means that if you sell 75 units, you’ll end up with zero profit (or loss) and will exactly reach even or zero. To test your calculation, you can prepare a contingent income statement for 75 units in sales (your break-even number). The resulting statement is shown in the table below. You want to do better than just break-even, so you could change this analysis to a targeted level of profit by adding that amount to your fixed costs and repeating the calculation. Break-even analysis is rather handy. It enables you to determine the level of sales that you must reach to avoid losing money and the level of sales that you must reach to earn a certain profit. Such information will be vital to planning your business.
Table 6. Stress-Buster Company Income Statement
|
Month Ended April 30, 2018 (at break–even level of sales = 75 units) |
||
|
Sales (75 x $10.00) |
|
$750 |
|
Less cost of goods sold (75 x $6) |
|
$450 |
|
Gross profit ($75 x ($10 – $6)) |
|
$300 |
|
Less operating expenses |
|
|
|
Salaries |
$240 |
|
|
Advertising |
$40 |
|
|
Table rental |
$20 |
|
|
Net income (Profit) ($300 – $300) |
|
$0 |
The Cash Flow Statement
The Cash Flow Statement provides valuable information about a company’s expenses and receipts and allows insights into its future income needs to meet its future obligations (expenses and receipts). Cash flow statement’s report cash inflows and outflows, and it will identify the amount of cash the company currently holds, which is also reported in the balance sheet.
Typically, the cash flow statement is reported on a month-to-month basis, however, a statement of cash flow will consolidate month-to-month cash flow to meet the International Financial Reporting Standards.
A statement of cash flow will report cash in three distinct areas of business:
Operations.
Investing.
Financing.
Now let us prepare the statement of cash flow for Stress-Buster company for the one-month period ending April 30, 2018. Stress-Buster would have incurred cash from Operations as Net Income incurred after deducting the month’s expenses from the month’s revenues and would have also incurred cash from Financing from the initial $400 loan taken out to start the business and the additional $200 of personal income. As Stress-Buster did not invest in new equipment, machinery, or other assets for the business or use prior cash flows and/or kept earning to earn further investment income, Stress-Buster would not report any cash from investing activities.
Table 7. Stress-Buster Company Statement of Cash Flow
|
Month Ended April 30, 2018 |
||
|
Beginning Cash |
|
$0 |
|
Operating Activities |
|
$100 |
|
Net Income from Operations |
$100 |
|
|
Investing Activities |
|
$0 |
|
Financing Activities |
|
$600 |
|
Increase in Short-Term Debt |
$400 |
|
|
Increase in Retained Earnings |
$200 |
|
|
Ending Cash Balance (Net Change) |
|
$700 |
Financial Statement Analysis
Now that you know a bit about financial statements, let us see how they are used to help owners, managers, investors, and creditors assess a firm’s performance and financial strength. You can glean a wealth of information from financial statements, but first you need to learn a few basic principles for “unlocking” it.
Trend Analysis from the Income Statement
Figure 6. Apple Inc. Income Statement
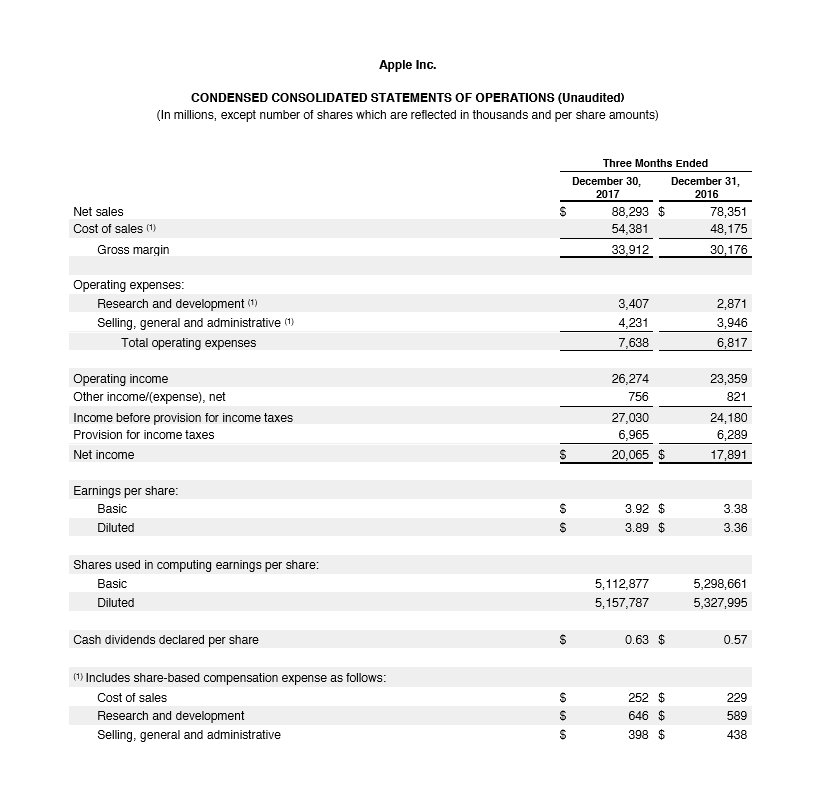
Peruse an abbreviated financial statement for Apple for 2017 taken directly from their website. You note that instead of showing only the current year’s results, the company has shown data for the prior year as well.
From this relatively simple exhibit, considerable information about Apple’s performance. For example:
Apple sales grew at 12.7% from 2016 to 2017, not bad for a company with such a large base of sales already, but certainly not the rapid-growth company it once was. When making yearly comparisons this is commonly referred to as performing a horizontal analysis.
Net income as a percent of sales (a ratio also known as return on sales) was 22.7% in 2017, or for every $5 in sales, Apple turned more than $1 of it into profit. That is substantial! When calculating ratios as a percent of a larger figure (i.e., Net income as a percent of sales, or cash as a percent of Total Assets) this is commonly referred to as performing a vertical analysis.
Many other calculations are possible from Apple’s data, and we will look at a few more than we explore ratio analysis.
Ratio Analysis
How do you compare Apple’s financial results with those of other companies in your industry or with the other companies whose stock is available to investors? And what about your balance sheet? Are there relationships on this statement that also warrant investigation? These issues can be explored by using ratio analysis, a technique for evaluating a company’s financial performance.
Remember that a ratio is just one number divided by another, so expressing the relationship between the two numbers. It is hard to learn much from just one ratio, or even several ratios covering the same period. Rather, the deeper value in ratio analysis lies in looking at the trend of ratios over time and in comparing the ratios for several time periods with those of other companies. There are several ways to categorize financial ratios.

SOURCE: Stevepb.
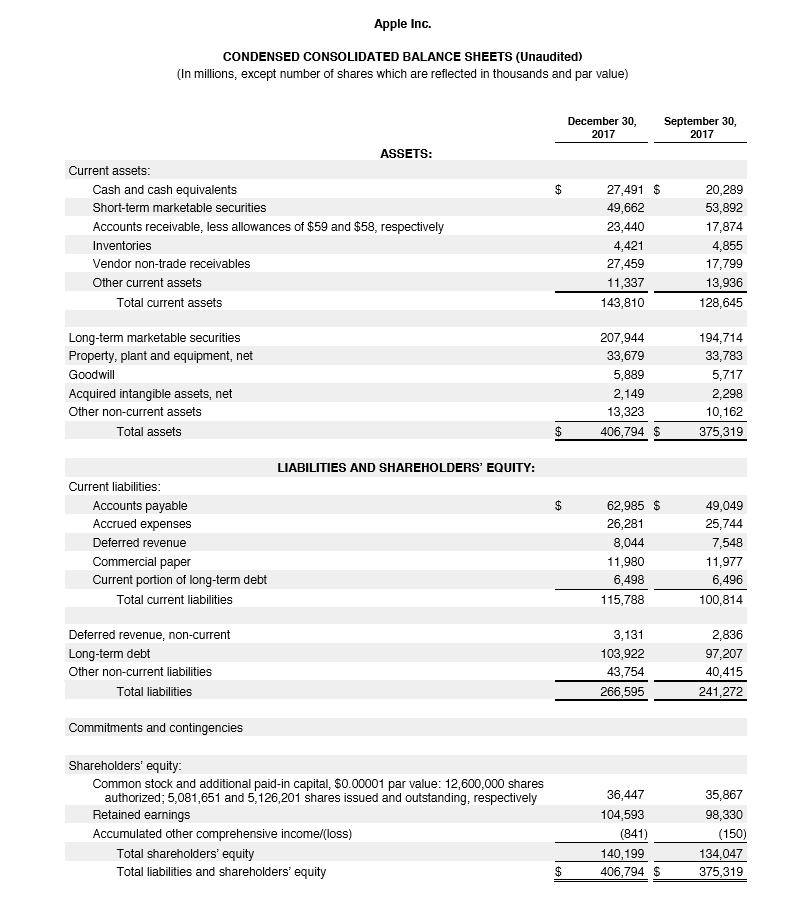
Figure 7. Apple Inc. Consolidated Balance Sheets
Here is one set of categories:
Profitability ratios tell you how much profit is made relative to the amount invested (return on investment) or the amount sold (return on sales).
Liquidity ratios tell you how well positioned a company is to pay its bills in the near term. Liquidity refers to how quickly an asset can be turned into cash. For example, the share of stock is substantially more liquid than a building or a machine.
Debt ratios look at how much borrowing a company has done to finance the operations of the business. The more borrowing, the more risk a company has taken on, and so the less likely it would be for new lenders to approve loan applications.
Efficiency ratios tell you how well your assets are being managed.
We could employ many ratios but will focus on a few key examples.
Profitability Ratios
Earlier we looked at the return on sales for Apple. Another profitability ratio on which the financial markets focus is earnings per share, also known as EPS. This ratio divides net income by the number of shares of stock outstanding. According to the earlier exhibit, Apple saw its EPS increase from $3.38 in 2016 to $3.92 in 2017, which shows a profit of about 15% an excellent return for a company that is already among the world’s largest. Well-paid analysts will spend hours to understand how these results were achieved every time Apple issues new financial statements.
Liquidity Ratios
Liquidity ratios are one element of measuring the financial strength of a company. They assess its ability to pay its current bills. A key liquidity ratio is called the current ratio. It simply examines the relationship between a company’s current assets and its current liabilities. On December 30, 2017 (remember that balance sheets reflect a point in time), Apple had $68.5 billion in current assets and $63.5 billion in current liabilities. Simply, what this means is that Apple has more money on hand than they need to pay their bills. When a company has a current ratio greater than 1, they are in good shape to pay their bills; companies selling to Apple on credit would not need to worry that it is likely to run out of money.
Apple’s current ratio = $68.5 Billion / $63.5 Billion = 1.08 (greater than >) 1
Now, let us peek at something that is not part of the ratio; look down one line on the balance sheet to long-term marketable securities and see that Apple owns $207.9 billion. While they are long-term and so not part of the current ratio, these securities are still easily convertible to cash. Apple has far more cushion than the current ratio reflects, even though it reflected a healthy financial position already.
Debt Ratios
A key debt ratio, which tells us how the company is financed, is the debt to equity ratio, which calculates the relationship between funds gained from creditors (debt) and funds invested by owners (equity). For this ratio calculation, we use Apple’s total liabilities, not just the line on the balance sheet that says long-term debt, because in effect, Apple is borrowing from those who it owes but has not yet paid. Apple’s total liabilities at the end of 2017 were $266.6 billion versus owner’s equity of $140.2 billion, a ratio of 1.9, which means Apple has borrowed more than it has invested in the business.
Apple’s debt to equity ratio: $266.6 / $140.2 Billion = 1.9
To some investors, that high-level of debt might seem alarming. But remember that Apple has $207.9 billion invested in marketable securities. If it wished to do so, Apple could sell some of those securities and pay down its debts, thus improving its ratio. It is likely that anyone thinking about lending money to Apple and seeing these figures would be confident that Apple can pay back what they borrow.
Efficiency and Effectiveness Ratios
There are many more ratios which we could apply to Apple to understand its performance more completely. Yet going deeper into ratios would be beyond an introductory business course. If you continue your study of business, you will get ample exposure to these ratios in your accounting and finance courses.

SOURCE: Pixabay.
Key Takeaways
Accounting is measuring and summarizing business activities, interpreting financial information, and communicating the results to management and other decision makers.
Managerial accounting deals with information produced for internal users, while financial accounting deals with external reporting.
The income statement captures sales and expenses and shows how much a firm made or lost in that period.
The balance sheet reflects the financial position of a firm at a point in time, including its assets, liabilities, and owner’s equity.
- It is based on the following equation: assets – liabilities = owner’s equity.
Break-even analysis is a technique used to determine the level of sales needed to break-even to operate at a sales level at which you have neither profit nor loss.
Ratio analysis is used to assess a company’s performance and financial condition over time and to compare one company to similar companies or to an overall industry.
Categories of ratios include profitability ratios, liquidity ratios, debt ratios, and efficiency and effectiveness ratios.

Feedback/Errata