
Main Body
Social Inequality in Canada
Dr. Susan Robertson
Foundations in Sociology II by Susan Robertson is licensed under a Creative Commons Attribution 4.0 International License, except where otherwise noted. Edited by Matthew Pauley.
Introduction to Social Inequality in Canada
Learning Objectives
What Is Social Inequality?
- Break the concept of social inequality into its component parts: social differentiation, social stratification, and social distributions of wealth, income, power, and status.
- Define the difference between equality of opportunity and equality of condition.
- Distinguish between caste and class systems.
- Distinguish between class and status.
- Identify the structural basis for the different classes that exist in capitalist societies.
Social Inequality and Mobility in Canada
- Define the difference between relative and absolute poverty.
- Describe the current trend of increasing inequalities of wealth and income in Canada.
- Distinguish the the differences between Marx’s and Weber’s definitions of social class and explain why they are significant.
- Characterize the social conditions of the owning class, the middle class, and the traditional working class in Canada.
- Apply the research on social mobility to the question of whether Canada is a meritocracy.
- Recognize cultural markers that are used to display class identity.
Global Stratification and Inequality
- Define global inequality.
- Describe different sociological models for understanding global inequality.
- Understand how sociological studies identify worldwide inequalities.
Theoretical Perspectives on Social Inequality
- Understand and apply functionalist, critical sociological and interpretive perspectives on social inequality.
Figure 1. Status Symbol

- The car a person drives can be seen as a symbol of money and power. What does a Rolls-Royce signify about its owner? Why? Source: Rolls Royce outside the Bellagio hotel in Las Vegas by Dave_7 (https://www.flickr.com/photos/daveseven/5781666396/) used under a CC BY 2.0 license.

- Figure 2. Monuments

- The Ted Rogers statue with Ted Rogers Centre for Heart Research in the background. Who gets monumentalized in Canada, and who gets forgotten? Source: (Image courtesy of Oaktree/Wikimedia Commons).

When he died in 2008, Ted Rogers Jr., then CEO of Rogers Communications, was the fifth-wealthiest individual in Canada, holding assets worth $5.7 billion. In his autobiography (2008) he credited his success to a willingness to take risks, work hard, bend the rules, be on the constant look-out for opportunities, and be dedicated to building the business. In many respects, he saw himself as a self-made billionaire who started from scratch, seized opportunities, and created a business through his own initiative.
The story of Ted Rogers is not exactly rags to riches. His grandfather, Albert Rogers, was a director of Imperial Oil (Esso) and his father, Ted Sr., became wealthy when he invented an alternating current vacuum tube for radios in 1925. Ted Rogers Sr. went from this invention to manufacture radios, owning a radio station, and gaining a licence for TV broadcasting.
However, Ted Sr. died when Ted Jr. was five years old, and the family businesses were sold. His mother took Ted Jr. aside when he was eight and told him, “Ted, your business is to get the family name back” (Rogers, 2008). The family was still wealthy enough to send him to Upper Canada College, the famous private school that also educated the children from the Black, Eaton, Thompson, and Weston families. Ted seized the opportunity at Upper Canada to make money as a bookie, taking bets on horse racing from the other students. Then he attended Osgoode Hall Law School, where reportedly his secretary went to classes and took notes for him. He bought an early FM radio station when he was still in university and started in cable TV in the mid-1960s. By the time of his death, Rogers Communications was worth $25 billion. At that time just three families, the Rogers, Shaws, and Péladeaus, owned much of the cable service in Canada.
At the other end of the spectrum are the Aboriginal gang members in the Saskatchewan Correctional Centre who we discussed in Chapter 1 (CBC, 2010). The CBC program noted that 85% of the inmates in the prison were of Aboriginal descent, half of whom were involved in Aboriginal gangs. The statistical profile of Aboriginal youth in Saskatchewan is grim, with Aboriginal people making up the highest number of high school dropouts, domestic abuse victims, drug dependencies, and child poverty backgrounds. In some respects, the Aboriginal gang members interviewed were like Ted Rogers in that they will seize opportunities, take risks, bend rules, and apply themselves to their vocations. They too aspired to getting the money that would give them the freedom to make their own lives. However, as one inmate put it, “the only job I ever had was selling drugs” (CBC, 2010). The consequence of that was to fall into a lifestyle that led to joining a gang, being kicked out of school, developing issues with addiction, and eventually getting arrested and incarcerated. Unlike Ted Rogers, however, the inmate added, “I didn’t grow up with the best life” (CBC, 2010).
How do we make sense of the divergent stories? Canada is supposed to be a country in which individuals can work hard to get ahead. It is an “open” society. There are no formal or explicit class, gender, racial, ethnic, geographical, or other boundaries that prevent people from rising to the top. People are free to make choices. But does this adequately explain the difference in life chances that divide the fortunes of the Aboriginal youth from those of the Rogers family? What determines a person’s social standing? And how does social standing direct or limit a person’s choices?
The French sociologist Pierre Bourdieu (1930-2002) defined one’s habitus as the deeply seated schemas, habits, feelings, dispositions, and forms of know-how that people hold due to their specific social backgrounds, cultures, and life experiences (1990). Bourdieu referred to it as ones “feel for the game,” to use a sports metaphor. Choices are perhaps always “free” in some formal sense, but they are also always within one’s habitus. The Aboriginal gang members display a certain amount of street smarts that enable them to survive and successfully navigate their world. Street smarts define their habitus and exercise a profound influence over the range of options that are available for them to consider — the neighbourhoods they know to avoid, the body languages that signal danger, the values of illicit goods, the motives of different street actors, the routines of police interactions, etc. The habitus affects both the options to conform to the group they identify with or deviate from it. Ted Rogers occupied a different habitus, which established a unique set of options for him in his life path. How are the different life-worlds or habitus distributed in society so that some reinforce patterns of deprivation while others provide the basis for access to wealth and power?
As Bourdieu pointed out, habitus is so deeply ingrained that we take its reality as natural rather than as a product of social circumstances. This has the unfortunate effect of justifying social inequalities based on the belief that the Ted Rogers of the world were naturally gifted and predisposed for success when in fact it is success itself that is “predisposed” by underlying structures of power and privilege.
What Is Social Inequality?
Figure 3. The Glass Ceiling

- In the upper echelons of the working world, people with the most power reach the top. These people make the decisions and earn the most money. The majority of Canadians will never see the view from the top. Source: (Photo courtesy of Alex Proimos/Flickr)

Sociologists use the term social inequality to describe the unequal distribution of valued resources, rewards, and positions in a society. Key to the concept is the notion of social differentiation. Social characteristics — differences, identities, and roles — are used to differentiate people and divide them into different categories, which have implications for social inequality. Social differentiation by itself does not imply a division of individuals into a hierarchy of rank, privilege, and power. However, when a social category like class, occupation, gender, or race puts people in a position in which they can claim a greater share of resources or services, then social differentiation becomes the basis of social inequality.
The term social stratification refers to an institutionalized system of social inequality. It refers to a situation in which the divisions and relationships of social inequality have solidified into a system that determines who gets what, when, and why. You may remember the word “stratification” from geology class. The distinct horizontal layers found in rock, called “strata,” are a good way to visualize social structure. Society’s layers are made of people, and society’s resources are distributed unevenly throughout the layers. The people who have more resources represent the top layer of the social structure of stratification. Other groups of people, with progressively fewer and fewer resources, represent the lower layers of our society. Social stratification assigns people to socioeconomic strata based on factors like wealth, income, race, education, and power. The question for sociologists is how systems of stratification come to be formed. What is the basis of systematic social inequality in society?
Figure 4. Social Stratification

- Strata in rock illustrate social stratification. People are sorted, or layered, into social categories. Many factors determine a person’s social standing, such as income, education, occupation, age, race, gender, and even physical abilities. Source: (Photo courtesy of Just a Prairie Boy/Flickr)

In Canada, the dominant ideological presumption of social inequality is that everyone has an equal chance at success. This is the belief in equality of opportunity, which can be contrasted with the concept of equality of condition. Equality of condition is the situation in which everyone in a society has a similar level of wealth, status, and power. Although degrees of equality of condition vary markedly in modern societies, even the most egalitarian societies today have considerable degrees of inequality of condition. Equality of opportunity is the idea that everyone has an equal possibility of becoming successful. It exists when people have the same chance to pursue economic or social rewards. This is often seen as a function of equal access to education, meritocracy (where individual merit determines social standing), and formal or informal measures to eliminate social discrimination. Ultimately, equality of opportunity means that inequalities of condition are not so great that they hamper a person’s life chances. Whether Canada is a society characterized by equality of opportunity or not is a subject of considerable sociological debate.
To a certain extent, Ted Rogers’ story illustrates the belief in equality of opportunity. His personal narrative is one in which hard work and talent — not inherent privilege, birthright, prejudicial treatment, or societal values — determined his social rank. This emphasis on self-effort is based on the belief that people individually control their own social standing, which is a key piece in the idea of equality of opportunity. Most people connect inequalities of wealth, status, and power to the individual characteristics of those who succeed or fail. The story of the Aboriginal gang members, although it is also a story of personal choices, casts that belief into doubt. The type of choices available to the Aboriginal gang members are of a different range and quality than those available to the Rogers family and choices are a product of habitus.
Sociologists recognize that social stratification is a society-wide system that makes inequalities apparent. While there are always inequalities between individuals, sociologists are interested in larger social patterns. Social inequality is not about individual inequalities, but about systematic inequalities based on group membership, class, gender, ethnicity, and other variables that structure access to rewards and status. Sociologists are interested in examining the structural conditions of social inequality. There are of course differences in individuals’ abilities and talents that will affect their life chances. The larger question, however, is how inequality becomes systematically structured in economic, social, and political life. In terms of individual ability: Who gets the opportunities to develop their abilities and talents, and who does not? Where does “ability” or “talent” come from? As we live in a society that emphasizes the individual — i.e., individual effort, individual morality, individual choice, individual responsibility, individual talent, etc. — it is often difficult to see how life chances are socially structured.
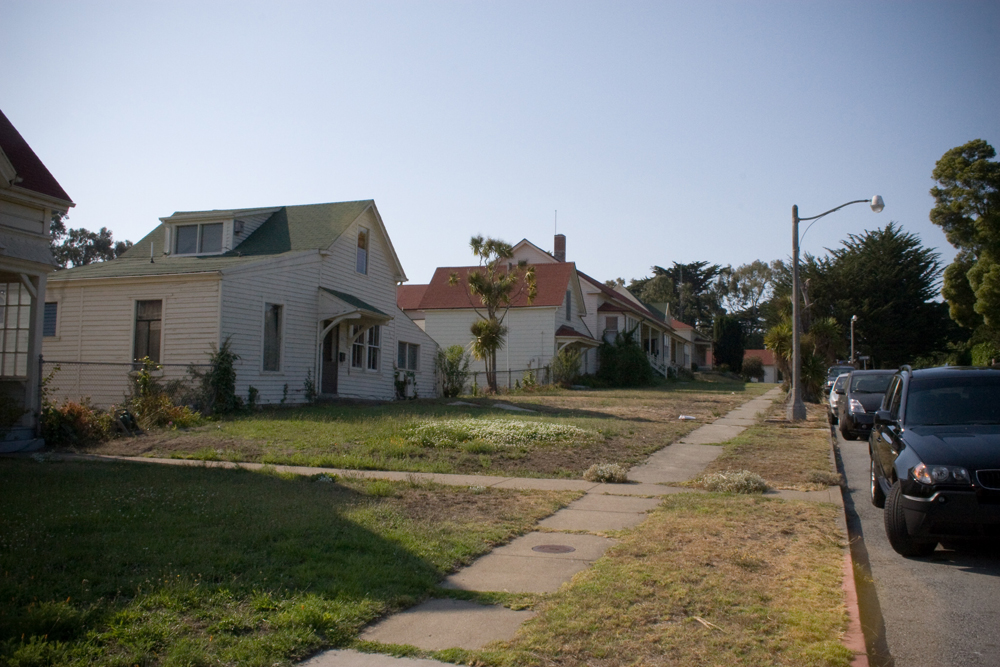
Figure 5. Income Disparity

- The people who live in these houses most likely share similar levels of income and education. Neighbourhoods often house people of the same social standing. Wealthy families do not typically live next door to poorer families, though this varies depending on the particular city and country. Source: (Photo courtesy of Orin Zebest/Flickr)
Factors that define stratification vary in different societies. In most modern societies, stratification is often showed by differences in wealth, the net value of money and assets a person has, and income, a person’s wages, salary, or investment dividends. It can also be defined by differences in power (how many people a person must take orders from versus how many people a person can give orders to) and status (honour or prestige one has in the eyes of others). These four factors create a complex amalgam that defines individuals’ social standing within a hierarchy.
Usually the four factors coincide, as with corporate CEOs, like Ted Rogers, at the top of the hierarchy—wealthy, powerful, and prestigious — and the Aboriginal offenders at the bottom — poor, powerless, and abject. Sociologists use the term status consistency to describe the consistency of an individual’s rank across these factors. However, we can also think of someone like the Canadian prime minister who ranks high in power, but with a salary of approximately $320,000 earns much less than comparable executives in the private sector (albeit eight times the average Canadian salary). The Prime Minister’s status or prestige also rises and falls with the vagaries of politics. The Nam-Boyd scale of status ranks politicians at 66/100, the same status as cable TV technicians (Boyd, 2008). There is status inconsistency in the Prime Minister’s position. Similarly, teachers often have high levels of education, which give them high status (92/100 according to the Nam-Boyd scale), but they receive relatively low pay. Many believe that teaching is a noble profession, so teachers should do their jobs for love of their profession and the good of their students, not for money. Yet, no successful executive or entrepreneur would embrace that attitude in the business world, where profits are valued as a driving force. Cultural attitudes and beliefs like these support and perpetuate social inequalities.
Systems of Stratification
Sociologists distinguish between two types of systems of stratification. Closed systems accommodate little change in social position. They do not allow people to shift levels and do not permit social relations between levels. Open systems, which are based on achievement, allow movement and interaction between layers and classes. Different systems reflect, emphasize, and foster certain cultural values, and shape individual beliefs. This difference in stratification systems can be examined by the comparison between class systems and caste systems.
The Caste System
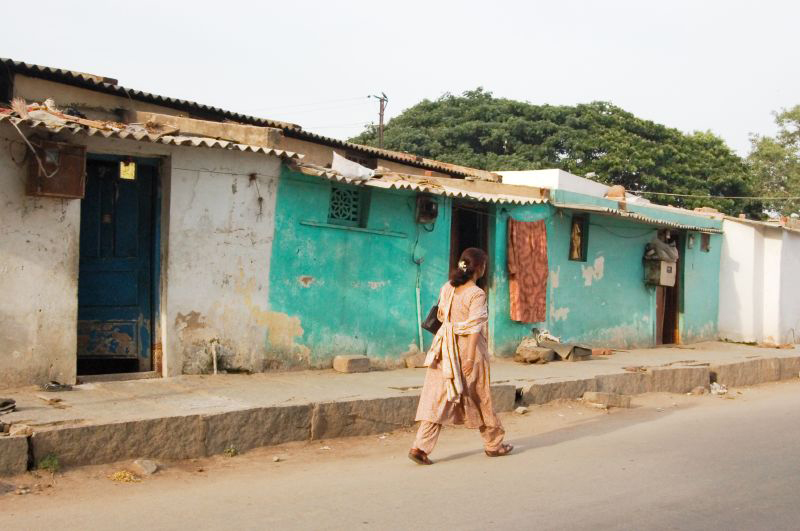
Figure 6. Caste System

- India used to have a rigid caste system. The people in the lowest caste suffered from extreme poverty and were shunned by society. Some aspects of India’s defunct caste system remain socially relevant. The Indian woman in this photo is of a specific Hindu caste. Source: (Photo courtesy of Elessar/Flickr)
Caste systems are closed stratification systems in which people can do little or nothing to change their social standing. A caste system is one in which people are born into their social standing and remain in it their whole lives. It is based on fixed or rigid status distinctions, rather than economic classes per se. As we noted above, status is defined by the level of honour or prestige one receives because of membership in a group. Sociologists distinguish between ascribed status — a status one receives because of being born into a category or group (e.g., hereditary position, gender, race, etc.) — and achieved status — a status one receives through individual effort or merits (e.g., occupation, educational level, moral character, etc.). Caste systems are based on a hierarchy of ascribed statuses, based on being born into fixed caste groups.
In a caste system, therefore, people are assigned roles regardless of their talents, interests, or potential. Marriage is endogamous, meaning that marriage between castes is forbidden. An exogamous marriage is a union of people from different social categories. There are virtually no opportunities to improve one’s social position. Instead, the relationship between castes is bound by institutionalized rules, and highly ritualistic procedures come into play when people from different castes come into contact.
The feudal systems of Europe and Japan can in some ways be seen as caste systems in that the statuses of positions in the social stratifications systems were fixed, and there was little or no opportunity for movement through marriage or economic opportunities. In Europe, the estate system divided the population into clergy (first estate), nobility (second estate), and commoners (third estate), which included artisans, merchants, and peasants. In early European feudalism, it was still possible for a peasant or a warrior to achieve a prominent position in the clergy or nobility, but later the divisions became more rigid. In Japan, between 1603 and 1867, the mibunsei system divided society into five rigid strata in which social standing was inherited. At the top was the emperor, then court nobles (kuge), military commander-in-chief (shogun), and the land-owning lords (daimyo). Beneath them were four classes or castes: the military nobility (samurai), peasants, artisans, and merchants. The merchants were considered the lowest class because they produced nothing with their own hands. There was also an outcast or untouchable caste known as the burakumin, who were impure or defiled because of their association with death: executioners, undertakers, slaughterhouse workers, tanners, and butchers (Kerbo, 2006).
However, the caste system is probably best typified by the system of stratification that existed in India from 4,000 years ago until the 20th century. In the Hindu caste tradition, people were also expected to work in the occupation of their caste and to enter into marriage according to their caste. Originally, there were four castes: Brahmans (priests), Kshatriyas (military), Vaisyas (merchants), and Sudras (artisans, farmers). In addition there were the Dalits or Harijans (“untouchables”). Hindu scripture said, “In order to preserve the universe, Brahma (the Supreme) caused the Brahmin to proceed from his mouth, the Kshatriya to proceed from his arm, the Vaishya to proceed from his thigh, and the Shudra to proceed from his foot” (Kashmeri, 1990). Accepting this social standing was considered a moral duty. Cultural values and economic restrictions reinforced the system. Caste systems promote beliefs in fate, destiny, and the will of a higher power, rather than promoting individual freedom as a value. A person who lived in a caste society was socialized to accept his or her social standing.
Although the caste system in India has been officially dismantled, its residual presence in Indian society is deeply embedded. In rural areas, aspects of the tradition are more likely to remain, while urban centres show less evidence of this past. In India’s larger cities, people now have more opportunities to choose their own career paths and marriage partners. As a global centre of employment, corporations have introduced merit-based hiring and employment to the nation.
The Class System
A class system is based on both social factors and individual achievement. It is at least a partially open system. A class comprises a set of people who have the same relationship to the means of production or productive property, to the things used to produce the goods and services needed for survival: tools, technologies, resources, land, workplaces, etc. In Karl Marx’s analysis, class systems form around the institution of private property, dividing those who own or control productive property from those who do not, who survive based on their labour.
Social class has both a strictly material quality relating to these definitions of individuals’ positions within an economic system, and a social quality relating to the formation of common class interests, political divisions in society, sites of conflict and compromise, lifestyles and consumption patterns, and what Max Weber called different “life chances” (1969). We will return to the differences between Marx’s and Weber’s definitions of class later in this chapter. Whether defined by material or social characteristics however, the main social outcome of the class structure is inequality in society.
Marx argued class systems originated in early Neolithic horticultural societies when horticultural technologies increased yields to economic surpluses. The first class divisions developed between those who owned and controlled the agricultural land and surplus production and those who were dispossessed of ownership and control (i.e., the agricultural labourers). Prior to the Neolithic period 8,000 to 10,000 years ago, there were no classes. Societies were egalitarian and were characterized by equality of condition. For tens of thousands of years, hunter-gatherer societies shared productive property and resources collectively and did not produce economic surpluses. They could not form class societies.
In capitalism, the principle of class division is between the capitalist class who live from the proceeds of owning or controlling productive property (capital assets like factories and machinery, or capital itself as investments, stocks, and bonds) and the working class who live from selling their labour to the capitalists for a wage. Marx referred to these classes as the bourgeoisie and the proletariat, respectively. In addition, he described the classes of the petite bourgeoisie (the little bourgeosie) and the lumpenproletariat (the sub-proletariat). The petite bourgeoisie is those like shopkeepers, farmers, and contractors who own some property and perhaps employ a few workers but still rely on their own labour to survive. The lumpenproletariat are the chronically unemployed or irregularly employed who are in and out of the workforce. They are what Marx referred to as the “reserve army of labour,” a pool of potential labourers who are surplus to the needs of production.
In a class system, social inequality is structural, meaning that it is “built in” to the organization of the economy. The relationship to the means of production (i.e., ownership/non-ownership) defines a persistent, aim pattern of social relationships that exists prior to or outside of individuals’ personal or voluntary choices and motives. In Marx’s analysis, this was also the basis of class conflict, because objectively (i.e., beyond individuals’ personal perceptions or beliefs) the class positions are contradictory. The existence of the bourgeoisie is defined by the economic drive to accumulate capital and increase profit. The key means to achieve this in a competitive marketplace is by reducing the cost of production by lowering the cost of labour (by reducing wages, moving production to lower wage areas, or replacing workers with labour-saving technologies). This contradicts the interests of the proletariat, who seek to establish a sustainable standard of living by maintaining the level of their wages and the level of employment in society.
Making Connections: Social Policy and Debate
Figure 7. The Commoner Who Could Be Queen

- Prince William, Duke of Cambridge, who is in line to be King of England, married Catherine Middleton, a so-called commoner, meaning she does not have royal ancestry. Source: (Photo courtesy of UK_repsome/Flickr)
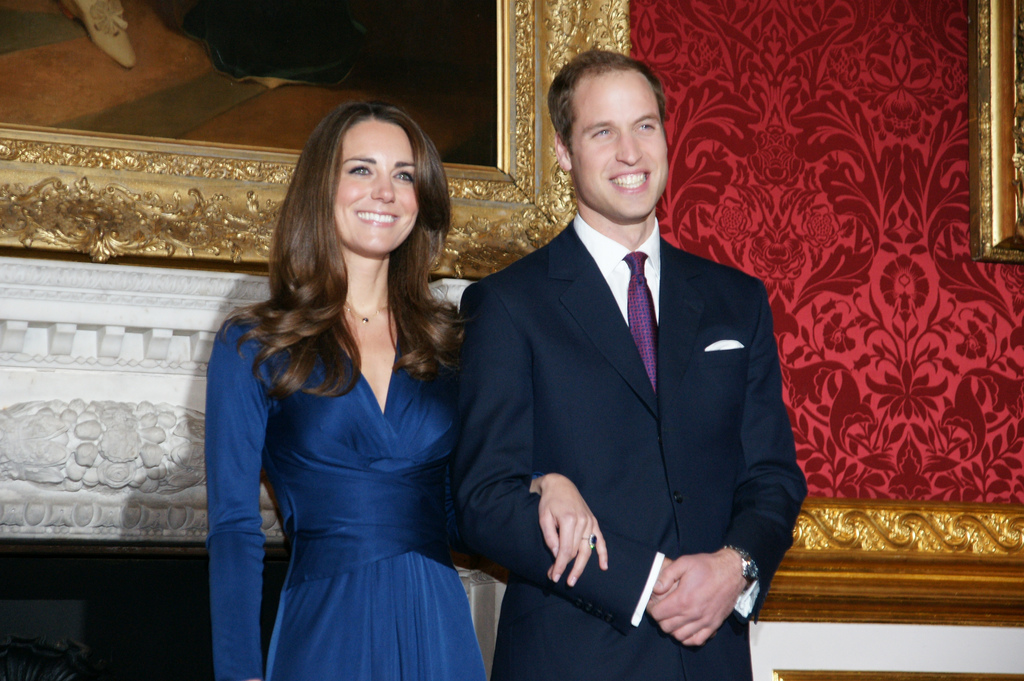
On April 29, 2011, in London, England, Prince William, Duke of Cambridge, married Catherine (“Kate”) Middleton, a commoner. It is rare, though not unheard of, for a member of the British royal family to marry a commoner. Kate Middleton had an upper-middle-class upbringing. Her father was a former flight dispatcher and her mother a former flight attendant. Kate and William met when they were both students at the University of St. Andrews in Scotland (Köhler, 2010).
Britain’s monarchy arose during the Middle Ages. Its social hierarchy placed royalty at the top and commoners on the bottom. This was generally a closed system, with people born into positions of nobility. Wealth was passed from generation to generation through primogeniture, a law stating that all property would be inherited by the firstborn son. If the family had no son, the land went to the next closest male relation. Women could not inherit property and their social standing was primarily determined through marriage.
The Industrial Revolution changed Britain’s social structure. Commoners moved to cities, got jobs, and made better livings. Gradually, people found new opportunities to increase their wealth and power. Today, the government is a constitutional monarchy with the prime minister and other ministers elected to their positions, and with the royal family’s role being ceremonial. The long-ago differences between nobility and commoners have blurred, and the modern class system in Britain is like that of the United States (McKee, 1996).
Today, the royal family still commands wealth, power, and a great deal of attention. When Queen Elizabeth II retires or passes away, Prince Charles will be first in line to ascend the throne. If he abdicates (chooses not to become king) or dies, the position will go to Prince William. If that happens, Kate Middleton would be called Queen Catherine and hold the position of queen consort. She would be one of the few queens in history to have earned a university degree (Marquand, 2011).
There is a great deal of social pressure on her not only to behave as a royal but to bear children. The royal family recently changed its succession laws to allow daughters, not just sons, to ascend the throne. Her firstborn son, Prince George, was born on July 22, 2013, so the new succession law is not likely to be tested soon. Kate’s experience — from commoner to possible queen — demonstrates the fluidity of social position in modern society.
While individual capitalists and individual workers might not see it this way, objectively, the class interests clash and define a persistent pattern of management-labour conflict and political cleavage structures in modern, capitalist societies.
However, unlike caste systems, class systems are open. People are at least formally free to gain a different level of education or employment than their parents. They can move up and down within the stratification system. They can also socialize with and marry members of other classes, allowing people to move from one class to another. Individuals can move up and down the class hierarchy, even while the class categories and the class hierarchy itself remain relatively stable.
This means that in a class system, one’s occupation is not fixed at birth. Though family and other societal models help guide a person toward a career, choice plays a role. For example, Ted Rogers Jr. chose a career in media similar to that of his father, but moved from a position of relative wealth and privilege in the petite bourgeoisie to being the fifth wealthiest bourgeois in the country. His father Ted Sr. chose a career in radio based on individual interests that differed from his own father’s. Ted Sr.’s father, Albert Rogers, held a position as a director of Imperial Oil. Ted Sr. therefore moved from the class of the bourgeoisie to the class of the petite bourgeoisie.
Social Inequality and Mobility in Canada
Most sociologists define social class as a grouping based on similar social factors like wealth, income, education, and occupation. As we note later in the chapter, there is a dispute within the discipline about the relative importance of different criteria for characterizing economic position. Whether the Marxist emphasis on property ownership is more important than the Weberian emphasis on gradations of occupational status is a matter of debate. Each definition captures some aspects of the experience of inequality in modern society, but misses others. Either way, the concept of class implies a shared standard of living based on social factors like wealth, income, education, and occupation. These factors also affect how much power and prestige a person has. In most cases, having more money means having more power or more opportunities.
Standard of Living
Figure 8. Poverty

- Source: (Image courtesy of Wayne Stadler/Flickr).
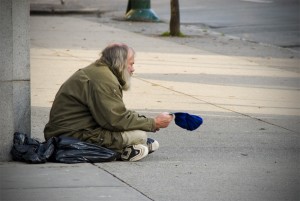
“When you’ve set up a place to sleep for the night, someone comes along and threatens you or forces you to leave, it’s no way to live. It’s tiring, to be forced to move every day or every night when you’re cold and wet and have no place to go.” (Testimony of Drug War Survivors member Harvey Clause, as quoted in Hollett, 2015)
In the last century, Canada has seen a steady rise in standard of living, the level of wealth available to gain the material necessities and comforts to maintain one’s lifestyle. The standard of living is based on factors such as income, employment, class, poverty rates, and affordability of housing. Because standard of living is closely related to quality of life, it can represent factors such as the ability to afford a home, own a car, and take vacations. Access to a standard of living that enables people to take part equally in community life is not equally distributed, however. The irony of rising standards of living is that one does not have to live in absolute poverty — “a severe deprivation of basic human needs, including food, safe drinking water, sanitation facilities, health, shelter, education and information” (United Nations, 1995) — to be marginalized and socially excluded. Relative poverty refers to the minimum amount of income or resources needed to take part in the “ordinary living patterns, customs, and activities” of a society (Townsend, 1979).
In Canada, a small portion of the population has the means to the highest standard of living. Statistics Canada data from 2005 showed that 10% of the population held 58% of our nation’s wealth (Osberg, 2008). In 2007, the richest 1% took 13.8% of the total income earned by Canadians (Yalnizyan, 2010). In 2010, the median income earner in the top 1% earned 10 times more than the median income earner of the other 99% (Statistics Canada, 2013). Wealthy people receive the most schooling, have better health, and consume the most goods and services. Wealthy people also wield decision-making power. One aspect of their decision-making power comes from their positions as owners or top executives of corporations and banks. They can grant themselves salary raises and bonuses. By 2010, only two years into the economic crisis of 2008, the executive pay of CEOs at Canada’s top 100 corporations jumped by 13% (McFarland, 2011), while negotiated wage increases in 2010 amounted to only 1.8% (HRSDC, 2010).
Many people think of Canada as a middle-class society. They think a few people are rich, a few are poor, and most are pretty well off, existing in the middle of the social strata. But as the data above shows, the distribution of wealth is not even. Millions of women and men struggle to pay rent, buy food, and find work that pays a living wage. The share of the total income claimed by those in the middle-income ranges has been shrinking since the early 1980s, while the share taken by the wealthiest has been growing (Osberg, 2008).
Making Connections: Sociological Research
Measuring Levels of Poverty
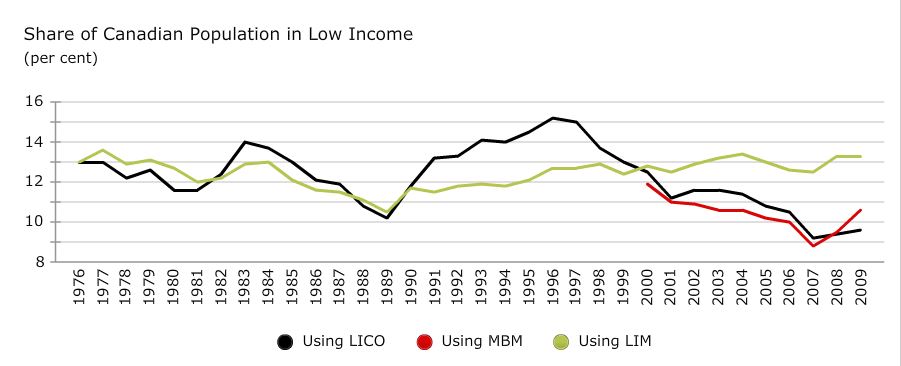
Statistics Canada produces two relative measures of poverty: the low income measure (LIM) and the low income cut-off (LICO) measure. Human Resources and Skills Development Canada has developed an absolute measure: the market basket measure (MBM).
Low income measure: The LIM is defined as half the median family income. A person whose income is below that level is said to be in low income. The LIM is adjusted for family size.
Low income cut-off: The LICO is the income level below which a family would devote at least 20 percentage points more of their income to food, clothing, and shelter than an average family would. People are said to be in the low-income group if their income falls below this threshold. The threshold varies by family size and community size, as well as if income is calculated before or after taxes. For example, a single individual in Toronto would be said to be living in low income if his or her 2009 after-tax income was below $18,421.
Market basket measure: The MBM is a measure of the disposable income a family would need to be able to purchase a basket of goods that includes food, clothing, shelter, transportation, and other basic needs. The dollar value of the MBM varies by family size and composition, as well as community size and location. MBM data are available since 2000 only.
The three measures produce different results. In 2009, according to each measure, the following numbers of Canadians were living in low income:
- LICO—3.2 million (9.6% of the population)
- MBM—3.5 million (10.6%)
- LIM—4.4 million (13.3%)
Table 1. shows how the three measures also produce different results. Using the LICO measure results in a decreasing share of people in low income from 1996 to 2007, followed by a slight upturn in 2008 and 2009. The LIM measure results in a share of people in low income that has increased since 1990. The MBM, which has data starting only in 2000, shows results similar to the LICO but with a sharper upturn in 2008 and 2009.
Table 1. Measuring Levels of Poverty

- “Measuring Levels of Poverty” excerpted from The Conference Board of Canada “Canadian Income Inequality: Is Canada becoming more unequal?” Source: (2011, http://www.conferenceboard.ca/hcp/hot-topics/caninequality.aspx). (Used under the Conference Board of Canada’s Terms of Use: http://www.conferenceboard.ca/terms_of_use.aspx)
Trends in Social Inequality
The news from sociological research into inequality is that the gap in income and wealth between the rich and the poor has been increasing in Canada (Osberg, 2008). In 1982, the median income earner in the top 1% of incomes earned seven times more than the median income earner in the other 99%. In 2010, the median income earner in the top 1% earned ten times more. While the median income for the top 1% increased from $191,600 to $283,000 in constant dollars (i.e., adjusted for inflation), the median income for the bottom 99% only increased from $28,000 to $28,400. In the early 1980s, the top 1% of income earners accounted for 7% of the total income generated in Canada, whereas in 2010 they accounted for 10.6%, down slightly from 12.1% in 2006 (Statistics Canada, 2013). In effect, the incomes for middle-income earners remained flat over the last 30 years, while the incomes for the top 1% increased significantly both in absolute terms and as a proportion of all incomes. (Note: Median income is not the same as average income. It refers to the amount that the person who is exactly in the middle of an income range earned: 50% of the people in this income range earned more than the median, and 50% earned less).
Table 2. Share of Aggregate Incomes Received by Each Quintile of Families and Unattached Individuals. (Table courtesy of Osberg, 2008/CCPA)
| Income Group | 1951 | 1961 | 1971 | 1981 | 1991 | 1996 | 2001 | 2005 |
|---|---|---|---|---|---|---|---|---|
| Bottom 20% (poorest) | 4.4% | 4.2% | 3.6% | 4.6% | 4.5% | 4.2% | 4.1% | 4.1% |
| Second 20% | 11.2% | 11.9% | 10.6% | 11% | 10% | 9.6% | 9.7% | 9.6% |
| Middle 20% | 18.3% | 18.3% | 17.6% | 17.7% | 16.4% | 16% | 15.6% | 15.6% |
| Fourth 20% | 23.3% | 24.5% | 24.9% | 25.1% | 24.7% | 24.6% | 23.7% | 23.9% |
| Top 20% (richest) | 42.8% | 41.1% | 43.3% | 41.6% | 44.4% | 45.6% | 46.9% | 46.9% |
Source: Sources Statistics Canada (1998) Income Distribution by Size in Canada Catalogue No. 13-207, CANSIM Table 202-0701, V1546465, J.R. Podoluk (1968) Incomes of Canadians, Dominion Bureau of Statistics.
This discrepancy does not simply mean that the very rich are increasing their share of the wealth at the expense of the very poor — the middle classes are also losing their share of the wealth. One way to analyze this trend is to examine the changing distribution of income in Canada. In Table 2. (above), changes in inequality are measured by looking at how the total annual income is distributed between each fifth (or “quintile”) of Canadian families from the lowest earning to highest earning for different years (Osberg, 2008). If perfect equality of income existed, each quintile would have earned exactly 20% of the total income. Instead, Table 9.2 shows that between 1951 and 1981, the top 20% of family units received around 42% of total income, but after 1981 this figure steadily increased to 47%. The share of income of the middle 60% of families declined by 4.7%, going from 53.8% to 49.1%. The lowest 20% also lost 0.5% of their already tiny share, going from 4.6% to 4.1%. Although most people in Canada have seen no growth in actual income in three decades (Osberg, 2008), the average income of the top 1% grew by about 180% (Yalnizyan, 2010). Over this period, the share of the total income received by the top 1% has doubled, the top 0.1% has tripled, and the top 0.01% has quintupled (Yalnizyan, 2010).
Why is this news? For several decades, Lars Osberg notes the joke was that the study of income inequality was like watching grass grow because nothing ever happened (2008). Between 1946 and 1981, changes in income inequality were small, although the Canadian economy went through a massive transformation: It transformed from an agricultural base to an industrial base; the population urbanized and doubled in size; the overall production of wealth measured by gross domestic product (GDP ) increased by 4.5%; and per capita output increased by 227% (Osberg, 2008). As Osberg puts it, the key question was why did economic inequality not change during this period of massive transformation? From 1981 until the present, during another period of rapid and extensive economic change in which the overall production of wealth continued to expand, economic inequality has increased dramatically. What happened?
The main explanatory factor is that between 1946 and 1981, real wages increased in pace with the growth of the economy, but since 1981 only the top 20% of families have seen any meaningful increase in actual income while the very wealthy have seen tremendous increases. The taxable income of the top 1% of families increased by 80% between 1982 and 2004 (Obsberg, 2008). Neoliberal policies of reduced state expenditures and tax cuts have been major factors in defining the difference between these two eras. The neoliberal theory that the benefits of tax cuts to the rich would “trickle down” to the middle class and the poor has proven false. The biggest losers regarding neoliberal policy, of course, are the very poor. As Osberg notes, it was not until the 1980s and 1990s that the homeless — those forced to beg in the streets and those dependent on food banks — appeared in Canada in significant numbers (2008).
Some have argued that to the degree that equality of opportunity exists, inequality of condition or inequality of “outcome” is perhaps not fair, but it is justifiable. Others have argued that because capitalism is built based on structural inequality, equality of condition is impossible. That equality of opportunity — a meritocracy — actually exists and that it leads to meaningful access to social mobility. The movement of people from one social position to another is debatable, as we will see below. Also, it is important to note that if total equality of condition — a world where everyone’s social position and financial rewards would be exactly the same — is unlikely, varying degrees of social inequality are possible. In fact, degrees of social inequality vary significantly between jurisdictions.
Table 3. Gini Index of inequality: 1980-2005

- Gini Index of inequality: 1980-2005 Source: (Figure courtesy of Osberg, 2008/CCPA)
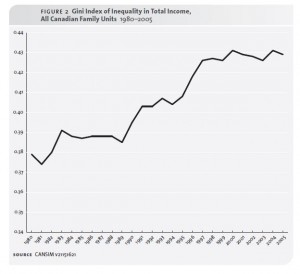
The Gini Index is a measure of income inequality in which zero is absolute equality and one is absolute inequality. Table 9.3 shows that Canada’s inequality increased by 5% between 1980 and 2005 from a Gini Index of 0.38 to 0.43 (Osberg, 2008). From a comparative perspective, Canada’s Gini Index is much higher than many European countries but is lower than the extremes of inequality in the United States and Mexico (who are Canada’s NAFTA partners). See Table 9.4 (below). This comparison shows that a much greater equality of condition can exist even under the same pressures of globalization if different social and economic policy models are chosen. Even though the countries with the lowest levels of inequality — Denmark, Sweden, the Netherlands, and Austria — have progressive tax systems and strong welfare states, they can maintain high levels of employment and economic growth while remaining “competitive” in the global economy (Osberg, 2010). If addressing poverty and inequality rather than promoting greater transfers of wealth to the rich is a reasonable goal, a variety of viable policy alternatives are available from which Canadians can choose.
Table 4. Gini Coefficients of Income Concentration in 27 OECD Countries, 2000 (or Most Recent Year)

- Source: (Figure courtesy of Osberg, 2008/CCPA)

Social Classes in Canada
Figure 9. The traditional working class
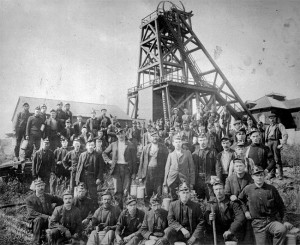
Miners in Nanaimo, B.C. (late 19th century). The Nanaimo coal mines were the site of a brutal two-year strike from 1912–1914 against low wages and dangerous working conditions. Source: Miners of Number One Mine, Nanaimo, at the pithead, B-03624. Source: (Image courtesy of the Royal B.C. Museum)
Figure 10. The owning class
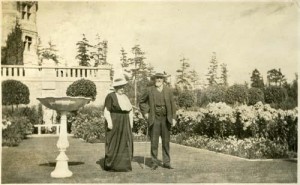
James and Laura Dunsmuir shown beside their Italian-style garden at their Hatley Castle residence near Victoria, B.C. (now part of Royal Roads University). James Dunsmuir was heir to his family’s coal fortune and managed the family coal operations on Vancouver Island from 1876–1910. He was a powerful spokesman for capitalist interests and anti-union efforts in B.C. and spent two years as B.C. Premier from 1900–1902. Source: (Image courtesy of the Royal B.C. Museum)
Does a person’s appearance show class? Can you tell a person’s education level based on clothing? Do you know a person’s income by the car one drives? There was a time in Canada when people’s class was more visibly apparent. In some countries, like the United Kingdom, class differences can still be gauged by differences in schooling, lifestyle, and even accent. In Canada, however, it is harder to determine class from outward appearances.
For sociologists, too, categorizing class is a fluid science. The chief division in the discipline is between Marxist and Weberian approaches to social class (Abercrombie & Urry, 1983). Marx’s analysis, as we saw earlier in this chapter, emphasized a materialist approach to the underlying structures of the capitalist economy. Marx’s definition of social class rested essentially on one variable: a group’s relation to the means of production (ownership or non-ownership of productive property or capital). In Marxist class analysis there are, therefore, two dominant classes in capitalism — the working class and the owning class — and any divisions within the classes based on occupation, status, education, etc. are less important than the tendency toward the increasing separation and polarization of these classes.
Weber defined social class slightly differently, as the “life chances” or opportunities to gain rewards one shares in common with others because of one’s possession of property, goods, or opportunities for income (1969). Owning property/capital or not owning property/capital is still the basic variable that defines a person’s class situation or life chances. However, class is defined regarding markets rather than the process of production. It is the value of one’s products or skills on the labour market that determines whether one has greater or lesser life chances. This leads to a hierarchical class schema with many gradations. A surgeon who works in a hospital is a member of the working class in Marx’s model, just like cable TV technicians, for example, because he or she works for a wage or salary. The skill the surgeon sells is valued much more highly in the labour market than cable TV technicians because of the relative rarity of the skill, the number of years of education required to learn the skill, and the responsibilities involved in practising the skill.
Analyzes of class inspired by Weber emphasize gradations of status regarding several variables like wealth, income, education, and occupation. Class stratification is not just determined by a group’s economic position but by the prestige of the group’s occupation, education level, consumption, and lifestyle. It is a matter of status — the level of honour or prestige one holds in the community because of ones social position — as much as a matter of class. Based on the Weberian approach, some sociologists talk about upper, middle, and lower classes (with many subcategories within them) in a way that mixes status categories with class categories. These gradations are often referred to as a group’s socio-economic status (SES), their social position relative to others based on income, education, and occupation. For example, although plumbers might earn more than high school teachers and have greater life chances in a particular economy, the status division between blue-collar work (people who “work with their hands”) and white-collar work (people who “work with their minds”) means that plumbers, for example, are characterized as lower class but teachers as middle class. There is an arbitrariness to the division of classes into upper, middle, and lower.
However, this manner of classification based on status distinctions captures something about the subjective experience of class and the shared lifestyle and consumption patterns of class that Marx’s categories often do not. An NHL hockey player receiving a salary of $6 million a year is a member of the working class. He might even go on strike or get locked out according to the dynamic of capital/labour conflict described by Marx. It is difficult to see what the life chances of the hockey player have in common with a landscaper or truck driver, although they might share a common working-class background.
Social class is, therefore, a complex category to analyze. Social class has both a strictly material quality relating to a group’s structural position within the economic system, and a social quality relating to the formation of status gradations, common subjective perceptions of class, political divisions in society, and class-based lifestyles and consumption patterns. Considering both the Marxist and Weberian models, social class has at least three components: a group’s position in the occupational structure, a group’s position in the authority structure (i.e., who has authority over whom), and a group’s position in the property structure (i.e., ownership or non-ownership of capital). It also has an important subjective component that relates to recognitions of status, distinctions of lifestyle, and ultimately how people perceive their place in the class hierarchy.
One way of distinguishing the classes that takes this complexity into account is by focusing on the authority structure. Classes can be divided according to how much relative power and control members of a class have over their lives. On this basis, we might distinguish between the owning class (or bourgeoisie), the middle class, and the traditional working class. The owning class not only has power and control over their own lives, their economic position gives them power and control over others’ lives as well. To the degree that we can talk about a “middle class” composed of small business owners and educated, professional, or administrative labour, it is because they rarely control other strata of society, but they exert control over their own work. In contrast, the traditional working class has little control over their work or lives. Below, we will explore the major divisions of Canadian social class and their key subcategories.
Making Connections: Classic Sociologists
Marx and Weber on Social Class: How Do They Differ?
| Figure 11. Max Weber | Figure 12. Karl Marx |
 |
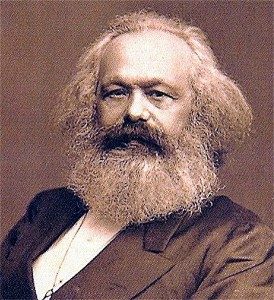 |
| Max Weber: Class as common “life chances” based on possession of goods and opportunities for income Source: (Image courtesy of Wikimedia Commons) | Karl Marx: Class as relationship to the means of production Source: (Image courtesy of Wikimedia Commons). |
Often, Marx and Weber are perceived to be at odds in their approaches to class and social inequality, but it is perhaps better to see them as articulating different styles of analysis. Weber’s analysis presents a more complex model of the social hierarchy of capitalist society than Marx. Weber’s model goes beyond structural class position to include the variables of status (degree of social prestige or honour) and power (degree of political influence). Thus, Weber provides a multi-dimensional model of social hierarchy. It is important to note that, although individuals might be from the same objective class, their position in the social hierarchy might differ according to their status and political influence. For example, women and men might be equal in terms of their class position, but because of the inequality in the status of the genders within each class, women as a group remain lower in the social hierarchy.
Regarding class, Weber also relies on a different definition than Marx. Weber defines class as the “life chances” one shares in common with others because of one’s possession of goods or opportunities for income (1969). Class is defined regarding markets rather than the process of production. As in Marx’s analysis, the economic interests that stem from owning property/capital or not owning property/capital are still the basic variables that define one’s class situation or life chances. However, as the value of unique property (i.e. industrial, real estate, financial, etc.) or different opportunity for income (i.e. different marketable skills) varies according to changes in the commodity or labour markets, Weber can provide a more nuanced description of an individual’s class position than Marx. A skilled tradesperson, like a pipe welder, might enjoy a higher class position and greater life chances in Northern Alberta where such skills are in demand, than a high school teacher in Vancouver or Victoria where the number of qualified teachers exceeds the number of positions available. If we add the element of status into the picture, the situation becomes even more complex as the educational requirements and social responsibilities of the high school teacher usually confer more social prestige than the requirements and responsibilities of the pipe welder. Weber’s analysis is descriptive rather than analytical. It can provide a useful description of differences between the levels or “strata” in a social hierarchy or stratification system, but does not analyze the formation of hierarchy itself.
Marx’s analysis of class is essentially one-dimensional. It has one variable: the relationship to the means of production. If one is a professional hockey player or a clerk in a supermarket, one works for a wage and is therefore a member of the working class. His analysis challenges common sense as the difference between the different “fragments” of the working class — those who survive by selling their labour for a wage or salary — seem paramount, at least from the point of view of the subjective experience of class. It would seem that hockey players, doctors, lawyers, professors, and business executives have very little in common with grocery clerks, factory or agricultural workers, tradespersons, or low level administrative staff although they all depend on being paid by someone. However, the key point of Marx’s analysis is not to ignore the existence of status distinctions within classes, but to examine class structure dialectically so to provide a more comprehensive and historical picture of class dynamics.
Everything is related; everything changes; change proceeds from the quantitative to the qualitative; and change is the product of the unity and struggle of opposites. These dialectical qualities are also central to Marx’s account of the hierarchical structure of classes in capitalist society. The focal point of the dialectical analysis of class is that the working class and the owning class have to be understood in relationship to one another. They emerged together out of the old class structure of feudalism, and each exists only because the other exists. The wages that define the wage labourer are paid by the capitalist; the profit and capital accumulated by the capitalist are products of the workers’ labour.
In Marx’s dialectical model, change occurs because the “unity” of this system is characterized by the struggle of opposites (i.e., the classes are “structurally in conflict” because of the contradiction in their class interests). The composition of classes changes over time; the statuses of different occupations vary; the proportions between workers’ income and capitalists’ profit change; and the production and the means of production change (through introducing labour-saving technologies, globalization, new commodities, etc.). In addition, change proceeds from the quantitative to the qualitative in the sense that changes in purely quantitative variables like salary, working conditions, unemployment levels, rates of profitability, etc. lead to changes in qualitative variables like the subjective experience of class, the divisions of “left” and “right” in political struggles, and the formation of class consciousness.
Thus, the strength of Marx’s analysis is its ability to go beyond a description of where different groups fit within the class structure at a given moment in time to an analysis of why those groups and their relative positions change regarding one another. The dialectical approach reveals the underlying logic of class structure as a dynamic system and the potential commonality of interests and subjective experiences that define class-consciousness. As a result, in an era in which the precariousness of many high status jobs has become clearer, the divisions of economic interests between the different segments of the working class becomes less so.
The Owning Class
Figure 13. The Owing Class

- Members of the upper class can afford to live, work, and play in exclusive places designed for luxury and comfort. Source: (Photo courtesy of PrimeImageMedia.com/Flickr)

The owning class is considered Canada’s top, and only the powerful elite get to see the view from there. In Canada, the richest 86 people (or families) account for 0.002% of the population, but in 2012 they had accumulated the equivalent wealth of the lowest 34% of the country’s population (McDonald, 2014). The combined net worth of these 86 families added up to $178 billion in 2012, which equalled the net worth of the lowest 11.4 million Canadians. In terms of income, in 2007, the average income of the richest 0.01% of Canadians was $3.833 million (Yalnizyan, 2010).
Money provides not just access to material goods, but also access to power. Canada’s owning class wields a lot of power. As corporate leaders, their decisions affect the job status of millions of people. As media owners, they shape the collective identity of the nation. They run the major network television stations, radio broadcasts, newspapers, magazines, publishing houses, and sports franchises. As philanthropists, they establish foundations to support social causes they believe in. They also fund think tanks like the C. D. Howe Institute and the Fraser Institute that promote the values and interests of business elites. As campaign contributors, they influence politicians and fund campaigns, usually to protect their own economic interests.
Canadian society has historically distinguished between “old money” (inherited wealth passed from one generation to the next) and “new money” (wealth you have earned and built yourself). While both types may have equal net worth, they have traditionally held different social standing. People of old money, firmly in the upper class for generations, have held high prestige. Their families have socialized them to know the customs, norms, and expectations that come with wealth. Often, the very wealthy do not work for wages. Some study business or become lawyers in order to manage the family fortune.
New money members of the owning class are not oriented to the customs and mores of the elite. They have not gone to the most exclusive schools. They have not established old-money social ties. People with new money might flaunt their wealth, buying sports cars and mansions, but they might still exhibit behaviours attributed to the middle and lower classes. For example, Toronto politicians Rob and Doug Ford are estimated to hold family assets worth $50 million, yet they present themselves as just “average guys” who stand with their blue-collar constituents against “rich elitist people” (McArther, 2013; Warner, 2014). Rob Ford’s infamous crack cocaine smoking, public binge drinking, and use of foul language would not make him at home within the circles of old money in Canada.
The Middle Class
Figure 14. The Middle Class

- These members of a club likely consider themselves middle class. Source: (Photo courtesy of United Way Canada-Centraide Canada/Flickr)

Many people call themselves middle class, but there are differing ideas about what that means. People with annual incomes of $150,000 call themselves middle class, as do people who annually earn $30,000. That helps explain why some sociologists divide the middle class into upper and lower subcategories. These divisions are based on gradations of status defined by levels of education, types of work, cultural capital, and the lifestyles afforded by income.
Upper-middle-class people hold bachelor’s and postgraduate degrees in subjects such as business, management, law, or medicine that lead to occupations in the professions. Professions are occupations that claim high levels of specialized technical and intellectual expertise and are governed and regulated by autonomous professional organizations (like the Canadian Medical Association or legal bar associations). Lower-middle-class members hold bachelor’s degrees or associate’s degrees from two-year community or technical colleges that lead to various types of white collar, service, administrative, or paraprofessional occupations.
Comfort is a key concept to the middle class. Middle-class people work hard and live fairly comfortable lives. Upper-middle-class people pursue careers that earn comfortable incomes. They provide their families with large homes and nice cars. They may go skiing or boating on vacation. Their children receive quality educations (Gilbert, 2010).
In the lower middle class, people hold jobs supervised by members of the upper middle class. They fill technical, lower-level management or administrative support positions. Compared to traditional working-class work, lower-middle-class jobs carry more prestige and come with slightly higher paycheques. With these incomes, people can afford a decent, mainstream lifestyle, but they struggle to maintain it. They rarely have enough income to build significant savings. In addition, their grip on class status is more precarious than in the upper tiers of the class system. When budgets are tight, lower-middle-class people are often the ones to lose their jobs.
The Traditional Working Class
Figure 15. The Working Class

- This man is a custodian at a restaurant. His job, which is crucial to the business, is considered lower class. Source: (Photo courtesy of Frederick Md Publicity/Flickr)

The traditional working class is sometimes also referred to as being part of the lower class. Just like the middle and upper classes, the lower class can be divided into subsets: the working class, the working poor, and the underclass. Compared to the middle class, traditional working-class people have less of an educational background and usually earn smaller incomes. While there are many working-class trades that require skill and pay middle-class wages, the majority often work jobs that require little prior skill or experience, doing routine tasks under close supervision.
Traditional working-class people, the highest subcategory of the lower class, are usually equated with blue-collar types of jobs: “wage-workers who are engaged in the production of commodities, the extraction of natural resources, the production of food, the operation of the transportation network required for production and distribution, the construction industry, and the maintenance of energy and communication networks” (Veltmeyer, 1986, p. 83). The work is considered blue collar because it is hands on and often physically demanding. The term “blue collar” comes from the traditional blue coveralls worn by manual labourers.
Beneath those in the working class are the working poor. Like some sections of the working class, they have unskilled, low-paying employment. However, their jobs rarely offer benefits such as retirement planning, and their positions are often seasonal or temporary. They work as migrant farm workers, house cleaners, and day labourers. Some are high school dropouts. Some are illiterate, unable to read job ads. Many do not vote because they do not believe that any politician will help change their situation (Beeghley, 2008).
How can people work full time and still be poor? Even working full time, more than a million of the working poor earn incomes too meagre to support a family. In 2012, 1.8 million working people (including 540,000 working full-time year round) earned less than Statistics Canada’s low income cut-off level, which defines poverty in Canada (Johnstone & Cooper, 2013). Minimum wage varies from province to province, from $9.95/h in Alberta to $11/h in Nunavut and Ontario (Retail Council of Canada, 2014). However, it is estimated that a living wage — based on a 35-hour work week — is $19.14/h in Vancouver, $16.60/h in Toronto, and $14.95/h in Hamilton (differences because of the difference in cost of living in these locations). A living wage is the amount needed to meet a family’s basic needs and enable them to take part in community life (Johnstone & Cooper, 2013). Even for a single person, the minimum wage is low. A married couple with children will have a hard time covering expenses.
The underclass or lumpenproletariat is Canada’s lowest tier. Members of the underclass live mainly in inner cities. Many are unemployed or underemployed. Those who hold jobs typically perform menial tasks for little pay. Some of the underclass are homeless. For many, welfare systems provide a much-needed support through food assistance, medical care, housing.
Social Mobility
Social mobility refers to the ability to change positions within a social stratification system. When people improve or diminish their economic status in a way that affects social class, they experience social mobility. This is a key concept in determining whether inequalities of condition limit people’s life chances or whether we can meaningfully speak of the existence of equality of opportunity in a society. High social mobility, upwards or downwards, would suggest that the stratification system of a society is in fact open (i.e., that there is equality of opportunity).
Upward mobility refers to an increase — or upward shift — in social class. In Canada, people applaud the rags-to-riches achievements of celebrities like Guy Laliberté who went from street busking in Quebec to being the CEO of Cirque du Soleil, with a net worth of $2.5 billion. Actor and comedian Jim Carey lived with his family in camper van at one point growing up in Scarborough, Ontario. Ron Joyce was a beat police officer in Hamilton before he co-founded Tim Hortons. CEO of Magna International Frank Stronach immigrated to Canada from Austria in 1955 with only $50 to his name. There are many stories of people from modest beginnings, rising to fame and fortune. But relative to the overall population, the number of people who launch from poverty to wealth is tiny. Still, upward mobility is not only about becoming rich and famous. In Canada, people who earn a university degree, get a job promotion, or marry someone with a good income may move up socially.
Downward mobility shows a lowering of one’s social class. Some people move downward because of business setbacks, unemployment, or illness. Dropping out of school, losing a job, or becoming divorced may cause a loss of income or status and, therefore, downward social mobility.
Intergenerational mobility explains a difference in social class between different generations of a family. For example, an upper-class executive may have parents who belonged to the middle class. Those parents may have been raised in the lower class. Patterns of intergenerational mobility can reflect long-term societal changes.
Intragenerational mobility describes a difference in social class between different members of the same generation. For example, the wealth and prestige experienced by one person may differ from that of his or her siblings.
Structural mobility happens when societal changes enable an entire group of people to move up or down the social class ladder. Structural mobility is because of changes in society, not individual changes. In the first half of the 20th century, industrialization expanded the Canadian economy, which raised the standard of living and led to upward structural mobility. In today’s work economy, the recession and the outsourcing of jobs overseas have contributed to high unemployment rates. Many people have experienced economic setbacks, creating a wave of downward structural mobility.
Many Canadians believe people move up in class because of individual efforts and move down by their own doing. In the ideal of equality of opportunity, one’s access to rewards would exactly equal one’s personal efforts and merits toward achieving those rewards. One’s class position or other social characteristics (gender, race, ethnicity, etc.) would not skew the relationship between merit and rewards. Others believe that equality of opportunity is a myth designed to keep people motivated to work hard, while getting them to accept social inequality as the legitimate outcome of personal achievement. The ideology of equality of opportunity is just a mirage that masks real and permanent structural inequality in society. The rich stay rich, and the poor stay poor. Data that measures social mobility suggest that the truth is a bit of both.
Typically, social mobility is measured by comparing either the occupational status or the earnings between parents and children. If children’s earnings or status remain the same as their parents then there is no social mobility. If children’s earnings or status moves up or down regarding their parents, then there is social mobility. Corak and colleagues compared “intergenerational earnings elasticity” between fathers and sons in Canada and the United States (2010). (Some data are available on daughters as well, but it is less common and therefore difficult to use to make cross-national comparisons.) Intergenerational earnings elasticity gives a percentage figure that shows the degree to which fathers’ income predicts sons’ income (i.e. the degree of intergenerational “stickiness” or lack of social mobility). The data show that there is a much lower social mobility in the United States than in Canada. While earnings elasticity (from 2006 data) in the United States was 0.47, meaning that almost one half of the fathers’ earning advantage was passed on to their sons, in Canada the figure was 0.19, meaning that less than one-fifth of the father’s earnings advantage was passed on. This suggests that Canada has a relatively high rate of social mobility and equality of opportunity compared to the United States, where almost 50% of sons remain at the same income level as their fathers. In an international comparison, the United Kingdom had even lower social mobility than the United States with an earnings elasticity of 0.50, while Finland, Norway, and Denmark had greater social mobility than Canada with earnings elasticities of 0.18, 0.17, and 0.15 respectively.
One of the key factors that distinguishes Canada’s social mobility from that of the United States is that the United States has a much greater social inequality to begin with. The higher degree of social inequality is linked to lower degrees of social mobility. The key factor that contributes to the difference in the intergenerational earnings elasticity figures is that there is a great degree of intergenerational social immobility at the lower and higher ranges of the income scale in the United States. For example, over 25% of sons born to fathers in the top 10% of income earners remain in the top 10%, compared to about 18% in Canada. In the United States, 22% of sons born to fathers in the bottom 10% of income earners remain in the bottom 10%, while another 18% only move up to the bottom 10 to 20% of income earners. The figures for Canada are 16% and 14% respectively (Corak et al., 2010).
However, these data also show that Canada not has “perfect” social mobility or equality of opportunity. Class background significantly affects one’s chances to get ahead. For example, the chance that a son born to a father in the 30 to 40% or 40 to 50% ranges of income earners (i.e., in 2004 families averaging $42,000 or $55,000 a year respectively) would move up into the top 50% of income earners (i.e., families averaging $65,000 a year or more) was about 50% (Yalnizyan, 2007). In contrast, a son from the bottom 20% of income earners had only a 38% chance of moving into the top 50 percent of income earners. For the bottom 20% of families, 62% of sons remained within the bottom 50% of income earners (Corak et al., 2010).
Class Traits
Figure 16. Class Traits

- Does taste or fashion sense indicate class? Is there any way to tell if this young man comes from an upper-, middle-, or lower-class background? Source: (Photo courtesy of Kelly Bailey/Flickr)

Class traits, also called class markers, are the typical behaviours, customs, and norms that define each class. They define a crucial subjective component of class identities. Class traits show the level of exposure a person has to a wide range of cultural resources. Class traits also show the amount of resources a person has to spend on items like hobbies, vacations, and leisure activities.
People may associate the upper class with enjoyment of costly, refined, or highly cultivated tastes — expensive clothing, luxury cars, high-end fundraisers, and opulent vacations. People may also believe that the middle and lower classes are more likely to enjoy camping, fishing, or hunting, shopping at large retailers, and taking part in community activities. It is important to note that while these descriptions may be class traits, they may also simply be stereotypes. Just as class distinctions have blurred in recent decades, so too have class traits. A very wealthy person may enjoy bowling as much as opera. A factory worker could be a skilled French cook. Pop star Justin Bieber might dress in hoodies, ball caps, and ill-fitting clothes, and a low-income hipster might own designer shoes.
These days, individual taste does not follow class lines. Still, you are not likely to see someone driving a Mercedes living in an inner-city neighbourhood. And most likely, a resident of a wealthy gated community will not be riding a bicycle to work. Class traits often develop based on cultural behaviours that stem from the resources available within each class.
Key Terms
absolute poverty: A severe deprivation of basic human needs, including food, safe drinking water, sanitation facilities, health, shelter, education and information.
achieved status: A status received through individual effort or merits (eg. occupation, educational level, moral character, etc.).
ascribed status: A status received by virtue of being born into a category or group (eg. hereditary position, gender, race, etc.).
bourgeoisie: In capitalism, the owning class who live from the proceeds of owning or controlling productive property (capital assets like factories and machinery, or capital itself in the form of investments, stocks, and bonds).
caste system: A system in which people are born into a social standing that they will retain their entire lives.
class: A group who shares a common social status based on factors like wealth, income, education, and occupation.
class system: Social standing based on social factors and individual accomplishments.
class traits: The typical behaviours, customs, and norms that define each class, also called class markers.
conspicuous consumption: Buying and using products to make a statement about social standing.
cultural capital: Cultural assets in the form of knowledge, education, and taste that can be transferred intergenerationally.
Davis-Moore thesis: A thesis that argues some social stratification is a social necessity.
downward mobility: A lowering of one’s social class.
empire: A new supra-national, global form of sovereignty whose territory is the entire globe.
endogamous marriages: Unions of people within the same social category.
equality of condition: A situation in which everyone in a society has a similar level of wealth, status, and power.
equality of opportunity: A situation in which everyone in a society has an equal chance to pursue economic or social rewards.
exogamous marriages: Unions of people from different social categories.
Gini Index: A measure of income inequality in which zero is absolute equality and one is absolute inequality.
global stratification: A comparison of the wealth, economic stability, status, and power of countries as a whole.
income: The money a person earns from work or investments.
intergenerational mobility: A difference in social class between different generations of a family.
intragenerational mobility: A difference in social class between different members of the same generation.
living wage: The income needed to meet a family’s basic needs and enable them to participate in community life.
lumpenproletariat: In capitalism, the underclass of chronically unemployed or irregularly employed who are in and out of the workforce.
means of production: Productive property, including the things used to produce the goods and services needed for survival: tools, technologies, resources, land, workplaces, etc.
meritocracy: An ideal system in which personal effort—or merit—determines social standing.
neoliberalism: A set of policies in which the state reduces its role in providing public services, regulating industry, redistributing wealth, and protecting the commons while advocating the use of free market mechanisms to regulate society.
petite bourgeoisie: In capitalism, the class of small owners like shopkeepers, farmers, and contractors who own some property and perhaps employ a few workers but rely on their own labour to survive.
power: How many people a person must take orders from versus how many people a person can give orders to.
primogeniture: A law stating that all property passes to the firstborn son.
proletariat: Those who seek to establish a sustainable standard of living by maintaining the level of their wages and the level of employment in society.
proletarianization (the act of being proletarianized): The process in which the work conditions of the middle class increasingly resemble those of the traditional, blue-collar working class.
relative poverty: Living without the minimum amount of income or resources needed to be able to participate in the ordinary living patterns, customs, and activities of a society.
social differentiation: The division of people into categories based on socially significant characteristics, identities, and roles.
social inequality: The unequal distribution of valued resources, rewards, and positions in a society.
social mobility: The ability to change positions within a social stratification system.
social stratification: A socioeconomic system that divides society’s members into categories ranking from high to low, based on things like wealth, power, and prestige.
socio-economic status (SES): A group’s social position in a hierarchy based on income, education, and occupation.
standard of living: The level of wealth available to acquire material goods and comforts to maintain a particular socioeconomic lifestyle.
status: The degree of honour or prestige one has in the eyes of others.
status consistency: The consistency, or lack thereof, of an individual’s rank across social categories like income, education, and occupation.
structural mobility: When societal changes enable a whole group of people to move up or down the class ladder.
upward mobility: An increase — or upward shift — in social class.
wealth: The value of money and assets a person has from, for example, inheritance.
Short Answer
- Track the social stratification of your family tree. Did the social standing of your parents differ from the social standing of your grandparents and great-grandparents? What social traits were handed down by your forebears? Are there any exogamous marriages in your history? Does your family exhibit status consistencies or inconsistencies?
- What defines communities that have a low-status consistency? What are the ramifications, both positive and negative, of cultures with low-status consistency? Think of specific examples to support your ideas.
- Review the concept of stratification. Now choose a group of people you have observed and been a part of — for example, cousins, high school friends, classmates, sport teammates, or coworkers. How does the structure of the social group you chose adhere to the concept of stratification?
Social Inequality and Mobility in Canada
- Which social class do you and your family belong to? Are you in a different social class than your grandparents and great-grandparents? Does your class differ from your social standing and, if so, how? What aspects of your societal situation establish you in a social class?
- What class traits define your peer group? For example, what speech patterns or clothing trends do you and your friends share? What cultural elements, such as taste in music or hobbies, define your peer group? How do you see this set of class traits as different from other classes either above or below yours?
- Provide examples of class inequality and of status inequality in your community. Are there examples in which class inequality differs from status inequality? What is the significance of these differences?
Global Stratification and Inequality
- Why is it important to understand and be aware of global stratification? Make a list of specific issues that are related to global stratification. For inspiration, turn on a news channel or read the newspaper. Next, choose a topic from your list and look at it more closely. Who is affected by this issue? How is the issue specifically related to global stratification?
- Compare a family that lives in a grass hut in Ethiopia to a Canadian family living in a mobile home in Canada. Assuming both exist at or below the poverty levels established by their country, how are the families’ lifestyles and economic situations similar and how are they different?
Theoretical Perspectives on Social Inequality
- Analyze the Davis-Moore thesis. Do you agree with Davis and Moore? Does social stratification play an important function in society? What examples can you think of that support the thesis? What examples can you think of that refute the thesis?
- Do you see any evidence of the growing gap between the rich and poor in Canada? What evidence do you see of the relative decline in wealth and income of the middle class? Does growing inequality affect you personally? What do you think the broader implications are?
Further Research
What Is Social Inequality?
The New York Times investigated social stratification in their series of articles called “Class Matters.” The online accompaniment to the series includes an interactive graphic called “How Class Works,” which tallies four factors — occupation, education, income, and wealth — and places an individual within a certain class and percentile. What class describes you? Test your class rank on the interactive site: http://www.nytimes.com/packages/html/national/20050515_CLASS_GRAPHIC/index_03.html
Social Inequality and Mobility in Canada
Mark Ackbar made a documentary about social class and the rise of the corporation called The Corporation. The filmmakers interviewed corporate insiders and critics. The accompanying website is full of information, resource guides, and study guides to the film.: http://thecorporation.com/.
Global Stratification and Inequality
Nations Online refers to itself as “among other things, a more or less objective guide to the world, a statement for the peaceful, nonviolent coexistence of nations.” The website provides a variety of cultural, financial, historical, and ethnic information on countries and peoples throughout the world: http://www.nationsonline.org/oneworld/first.shtml
References
Bourdieu, P. (1990). The logic of practice. Stanford, CA: Stanford University Press.
CBC Radio. (2010, September 14). Part 3: Former gang members. The Current [Audio file]. Retrieved from http://www.cbc.ca/thecurrent/2010/09/september-14-2010.html.
Rogers, T., & Brehl, R. (2008). Ted Rogers: Relentless. The true story of the man behind Rogers Communications. Toronto, ON: HarperCollins.
Boyd, M. (2008). A socioeconomic scale for Canada: measuring occupational status from the census. Canadian Review of Sociology, 45(1), 51-91.
Kashmeri, Z. (1990, October 13). Segregation deeply embedded in India. The Globe and Mail.
Kerbo, H. (2006). Social stratification and inequality: Class conflict in historical, comparative, and global perspective. Boston, MA: McGraw Hill.
Köhler, N. (2010, November 22). An uncommon princess. Maclean’s. Retrieved from http://www2.macleans.ca/2010/11/22/an-uncommon-princess/.
McKee, V. (1996, June 9). Blue blood and the color of money. The New York Times.
Marquand, R. (2011, April 15). What Kate Middleton’s wedding to Prince William could do for Britain. Christian Science Monitor. Retrieved from http://www.csmonitor.com/World/Europe/2011/0415/What-Kate-Middleton-s-wedding-to-Prince-William-could-do-for-Britain.
Abercrombie, N., & Urry, J. (1983). Capital, labour and the middle classes. London, UK: George Allen & Unwin.
Beeghley, L. (2008). The structure of social stratification in the United States. Upper Saddle River, NJ: Prentice Hall.
Corak, M., Curtis, L., & Phipps, S. (2010). Economic mobility, family background, and the well-being of children in the United States and Canada. [PDF] Institute for the Study of Labor. (Discussion paper no. 4814). Bonn, Germany. Retrieved from http://ftp.iza.org/dp4814.pdf.
DeVine, C. (2005). Class in turn-of-the-century novels of Gissing, James, Hardy and Wells. London, UK: Ashgate Publishing Co.
Gilbert, D. (2010). The American class structure in an age of growing inequality. Newbury Park, CA: Pine Forge Press.
Hollett, K. (2015). BC Supreme Court rules homeless have right to public spaces. Pivotlegal.org. Retrieved from http://www.pivotlegal.org/bc_supreme_court_rules_homeless_have_right_to_public_space.
Human Resources and Skills Development Canada. (2010). Average annual percentage wage adjustments. Retrieved from http://www.hrsdc.gc.ca/eng/labour/labour_relations/info_analysis/wages/adjustments/2010/09/quarterly.shtml.
Johnstone, A., & Cooper, T. (2013, May 1). It pays to pay a living wage. CCPA Monitor. Retrieved from https://www.policyalternatives.ca/publications/monitor/it-pays-pay-living-wage.
McArthur, G. (2013, November 23). Assessing the financial affairs of “average guy” Mayor Rob Ford. The Globe and Mail. Retrieved from http://www.theglobeandmail.com/news/toronto/assessing-the-financial-affairs-of-average-guy-mayor-rob-ford/article15574327/.
McDonald, D. (2014). Outrageous fortune: Documenting Canada’s wealth gap. [PDF] Canadian Centre for Policy Alternatives. Retrieved from https://www.policyalternatives.ca/sites/default/files/uploads/publications/National%20Office/2014/04/Outrageous_Fortune.pdf.
McFarland, J. (2011, May 29). Back in the green: CEO pay jumps 13 per cent. The Globe and Mail. Retrieved from http://www.theglobeandmail.com/report-on-business/careers/management/back-in-the-green-ceo-pay-jumps-13-per-cent/article582023/.
Osberg, L. (2008). A quarter century of economic inequality in Canada: 1981-2006. [PDF] Canadian Centre for Policy Alternatives. Retrieved from http://www.policyalternatives.ca/sites/default/files/uploads/publications/National_Office_Pubs/2008/Quarter_Century_of_Inequality.pdf.
Retail Council of Canada. (2014). Minimum wage by province. RCC: The Voice of Retail. Retrieved from http://www.retailcouncil.org/quickfacts/minimum-wage.
Statistics Canada. (2013, January 28). The daily — high-income trends among Canadian taxfilers, 1982 to 2010. Retrieved from http://www.statcan.gc.ca/daily-quotidien/130128/dq130128a-eng.htm.
Townsend, P. (1979). Poverty in the United Kingdom. London, UK: Penguin.
United Nations. (1995). Chapter 2: Eradication of poverty. The Copenhagen Declaration and Programme of Action, World Summit for Social Development. Retrieved from http://www.un.org/esa/socdev/wssd/text-version/agreements/poach2.htm.
Veltmeyer, H. (1986). Canadian class structure. Toronto, ON: Garamond.
Warner, B. (2014). Rob Ford net worth: How much is Rob Ford worth? Celebrity Networth. Retrieved from http://www.celebritynetworth.com/richest-politicians/republicans/rob-ford-net-worth/.
Weber, M. (1969). Class, status and party. In Gerth & Mills (Eds.), Max Weber: Essays in sociology (pp. 180-195). New York, NY: Oxford University Press.
Williams, R. (1984). Keywords: A vocabulary of culture and society. New York, NY: Oxford University Press. (Original work published 1976).
Yalnizyan, A. (2007, March 1). The rich and the rest of us: The changing face of Canada’s growing gap. [PDF] Canadian Centre for Policy Alternatives. Retrieved from https://www.policyalternatives.ca/sites/default/files/uploads/publications/National_Office_Pubs/2007/The_Rich_and_the_Rest_of_Us.pdf.
Yalnizyan, A. (2010). The rise of Canada’s richest 1%. [PDF] Canadian Centre for Policy Alternatives. Retrieved from http://www.policyalternatives.ca/sites/default/files/uploads/publications/National%20Office/2010/12/Richest%201%20Percent.pdf.
Beck, U. (2000). What is globalization? Cambridge, UK: Polity Press.
Campbell, B. (2013). The petro-path not taken: Comparing Norway with Canada and Alberta’s management of petroleum wealth. [PDF] Canadian Centre for Policy Alternatives. Retrieved from http://www.policyalternatives.ca/sites/default/files/uploads/publications/National%20Office/2013/01/Petro%20Path%20Not%20Taken_0.pdf.
CBC News. (2013, October 19). Former Fed chair Alan Greenspan on his free-market views. CBC. Retrieved from http://www.cbc.ca/news/business/former-fed-chair-alan-greenspan-on-his-free-market-views-1.2287039.
Hardt, M., & Negri, A. (2000). Empire. Cambridge, MA: Harvard University Press.
Harvey, D. (1989). The condition of postmodernity: An enquiry into the origins of cultural change. Cambridge, MA: Blackwell.
Harvey, D. (2005). A brief history of neoliberalism. London, UK: Oxford University Press.
Landler, M., & Sanger, D. E. (2009, April 3). World leaders pledge $1.1 trillion for crisis. The New York Times. Retrieved form http://www.nytimes.com/2009/04/03/world/europe/03summit.html.
Marx, K., & Engels, F. (1977). The communist manifesto. In D. McLellan (Ed.), Karl Marx: Selected writings (pp. 221–247). London, UK: Oxford University Press. (Original work published 1848.)
Millennium Project. (2006). Expanding the financial envelope to achieve the goals. Retrieved from http://www.unmillenniumproject.org/reports/costs_benefits2.htm.
Negri, A. (2004). Negri on Negri. New York, NY: Routledge
OECD. (2015, July 7). OECD health statistics 2015. Retrieved from http://www.oecd.org/els/health-systems/health-data.htm.
Rostow, W. W. (1960). The Stages of economic growth: A non-communist manifesto. Cambridge, MA: Cambridge University Press.
United Nations. (2015). The millennium development goals report [PDF]. Retrieved from http://www.un.org/millenniumgoals/2015_MDG_Report/pdf/MDG%202015%20rev%20(July%201).pdf.
Abercrombie, N., & Urry, J. (1983). Capital, labour and the middle classes. London, UK: George Allen & Unwin.
Basketball-reference.com. (2011). 2010–11 Los Angeles Lakers roster and statistics. Retrieved from http://www.basketball-reference.com/teams/LAL/2011.html.
Bourdieu, P. (1984). Distinction: A social critique of the judgement of taste. New York, NY: Routledge.
Davis, K., & Moore, W. E. (1945). Some principles of stratification. American Sociological Review, 10(2), 242–249. Retrieved from http://www.jstor.org/stable/2085643.
Marx, K. (1848). Manifesto of the Communist Party. Retrieved from http://www.marxists.org/archive/marx/works/1848/communist-manifesto/.
Shaienks, D., & Gluszynski, T. (2007). Participation in postsecondary education. Culture, Tourism and the Centre for Education Statistics Research Papers. Statistics Canada. Retrieved from http://www.pisa.gc.ca/eng/participation.shtml.
Statistics Canada. (2013, January 28). The Daily — High-income trends among Canadian taxfilers, 1982 to 2010. Retrieved from http://www.statcan.gc.ca/daily-quotidien/130128/dq130128a-eng.htm.
Tumin, M. M. (1953). Some principles of stratification: A critical analysis. American Sociological Review, 18(4), 387–394.
Veblen, T. (1994). The theory of the leisure class. New York, NY: Dover. (Original work published 1899).
Yalnizyan, A. (2007, March). “The rich and the rest of us: The changing face of Canada’s growing gap.” [PDF] Canadian Centre for Policy Alternatives. Retrieved from https://www.policyalternatives.ca/sites/default/files/uploads/publications/National_Office_Pubs/2007/The_Rich_and_the_Rest_of_Us.pdf.
Yalnizyan, A. (2010, December). The rise of Canada’s richest 1%. Canadian Centre for Policy Alternatives. [PDF] Retrieved from http://www.policyalternatives.ca/sites/default/files/uploads/publications/National%20Office/2010/12/Richest%201%20Percent.pdf.
